Award-Winning Statistics Tutors
serving Wilmington, NC
Statistics
Tutors in Wilmington
Private 1-on-1 tutoring, weekly live classes for academic support, test prep & enrichment, practice tests and diagnostics, and more to elevate grades and test scores.
Based on 3.4M Learner Ratings
UniversitiesSchools & Universities
DeliveredHours Delivered
ProficiencyGrowth in Proficiency
Who needs tutoring?
No obligation. Takes ~1 minute.
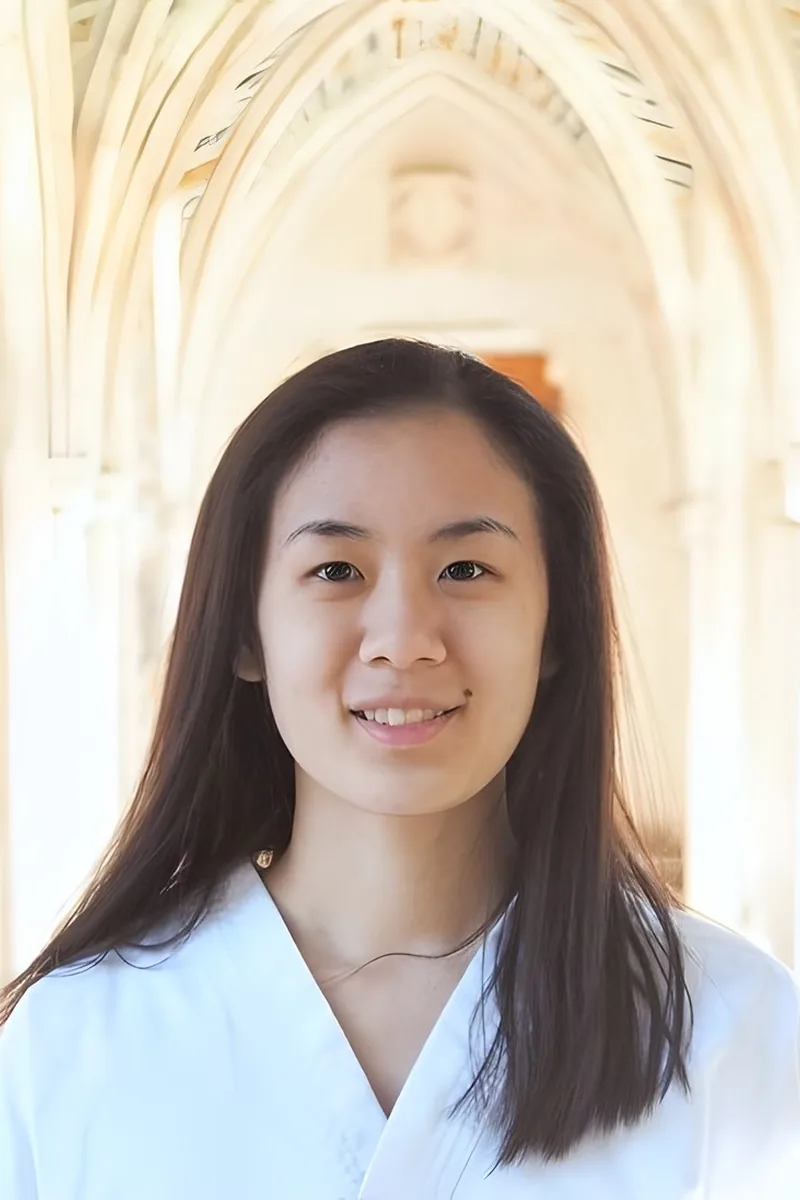
Probability distributions, hypothesis testing, and regression analysis all require a kind of structured thinking that Florence sharpened through her computer science degree at Duke. She teaches statistics by grounding each concept in real data scenarios — building intuition for what a p-value actually means before diving into formulas. Her 5.0 client rating speaks to how well that approach lands.

Probability distributions, hypothesis testing, confidence intervals — statistics asks you to think about uncertainty in a structured way, which trips up students used to math having one right answer. Roger scored a 5 on the AP Statistics exam and continues using statistical reasoning in his economics coursework at Duke. He breaks down the logic behind each test so students understand when and why to apply it, not just how to calculate.
Alisha treats statistics as a storytelling tool: every mean, standard deviation, and confidence interval is answering a specific question about real data. Her psychology minor at VCU gave her hands-on experience interpreting research studies, which she now uses to make concepts like probability distributions and hypothesis testing click for students.
Studying quantitative policy analysis at Duke, Matt applies statistical reasoning — hypothesis testing, regression, probability distributions — to real-world datasets every week. That daily practice means he teaches statistics as a way of thinking about evidence, not just a collection of calculator steps. He's especially effective at demystifying concepts like p-values and confidence intervals that textbooks often explain poorly.
Probability distributions, hypothesis testing, regression — statistics is ultimately about making defensible claims from messy data. Jordan ran exactly this kind of analysis throughout his bioengineering PhD at Georgia Tech, designing experiments and interpreting results where statistical rigor wasn't optional. He walks through each concept with the practical clarity of someone who's relied on it professionally.
Studying biological and physical sciences at Cornell means Katrina runs statistical analyses regularly, from interpreting p-values in lab reports to understanding distributions in research data. She brings that applied perspective to concepts like standard deviation, probability, and hypothesis testing, making the material feel purposeful rather than procedural.
Running statistical analyses on neural data throughout her PhD and postdoc at Duke, Kristina treats statistics as a practical toolkit, not a collection of formulas. She walks through probability distributions, hypothesis testing, and regression with an emphasis on understanding what each test actually tells you — and when it can mislead you.
Between his economics degree from Emory and his MBA work at Duke, Timothy has spent years immersed in statistical analysis — probability distributions, hypothesis testing, regression, and data interpretation. He teaches statistics as a decision-making tool, showing students how to read what the numbers actually say rather than just grinding through formulas. His 5.0 rating speaks to how clearly he makes that translation.
Public policy work at UNC Chapel Hill means Rishi lives in data — regression models, hypothesis testing, confidence intervals, and probability distributions are part of his daily academic toolkit. He breaks down statistical reasoning by connecting abstract formulas to real-world questions, like how survey data shapes policy decisions. Rated 5.0 by students.
Working at Google gave Rick a front-row seat to how statistics actually drives decisions — probability distributions, hypothesis testing, and regression analysis weren't academic exercises but daily tools. Now pursuing a PhD in Psychology, he's deep in research methods and statistical design all over again. That combination of industry and academic experience makes him particularly effective at teaching both the mechanics and the meaning behind statistical concepts.
Pre-med coursework at Duke — with minors in both biology and chemistry — means Rayhan has designed experiments, interpreted lab data, and run the kind of quantitative analyses where understanding p-values and confidence intervals actually matters. He teaches statistics concepts like hypothesis testing and variability by grounding them in scientific contexts, so the numbers connect to something tangible. Rated 5.0 by students.
Isabella's psychology background gave her hands-on experience with statistics that most tutors only know from a textbook — she's run hypothesis tests, built sampling distributions, and interpreted p-values for actual research projects. She unpacks concepts like standard deviation, probability distributions, and regression in terms of what the numbers actually tell you about the data.
Studying biology at Emory meant Matthew spent a lot of time designing experiments and interpreting data — calculating p-values, running chi-square tests, and making sense of regression output in ecology and genetics research. That hands-on statistical reasoning translates directly to teaching concepts like probability distributions, hypothesis testing, and confidence intervals. He connects each technique to real datasets so the logic behind the math stays clear.
Completing pre-med coursework at the University of Michigan meant Cailee spent serious time with statistical analysis — interpreting p-values, understanding distributions, and designing experiments with proper controls. She teaches students to read data critically rather than just memorize formulas for mean, standard deviation, and probability.
The jump from computing a standard deviation to actually interpreting what it means about a dataset is where most statistics students stall out. Kathleen tackles probability distributions, hypothesis testing, and confidence intervals by tying every formula to the question it answers. Her parallel experience in biostatistics and college-level stats means she can adapt explanations whether the course leans theoretical or applied.
Teaching statistics across multiple college campuses — including courses in public health and social sciences — gave David a unusual vantage point: he knows how stats actually gets used in research, from designing surveys to running significance tests on messy real-world data. As a PhD student in anthropology, he regularly wrangles datasets that don't behave neatly, which means he can walk students through what to do when assumptions break down or results look ambiguous. Rated 5.0 by students.
Probability distributions, confidence intervals, and hypothesis tests start making sense when you see them as tools for answering real questions rather than abstract formulas. Joshua ran statistical analyses throughout his psychology research at Furman and Purdue, which means he can explain concepts like p-values and standard error using concrete experimental examples. That research background makes him particularly effective at connecting computation to interpretation.
A Statistics B.S. makes Taylor one of those rare tutors who can teach this subject from genuine expertise — not just textbook familiarity. She digs into probability distributions, hypothesis testing, and regression analysis by connecting each concept to real data scenarios, making abstract formulas feel purposeful. Her 4.9 rating speaks to how well that approach lands with students.
Double-majoring in mathematics-statistics and political science, Sarah lives at the intersection where data meets argument — she's constantly interpreting polling numbers, analyzing demographic trends, and testing whether policy claims hold up under scrutiny. That daily practice with real datasets means she teaches concepts like hypothesis testing, regression, and probability as tools for answering actual questions, not just textbook exercises.
Having studied statistics at the undergraduate level and then earned a master's in math education, Jenna understands both the mathematical theory and how to actually teach it. She digs into the concepts students find slippery — when to use a t-test versus a z-test, how to interpret p-values without falling into common traps, and what a sampling distribution really represents.
I am Professor Florence. I teach at USC, UCSB, Pepperdine University, CSUN, Cal Tech, and other Universities. I received my bachelor's in Math and Psychology at UCLA, Ph.D. work in Engineering at Virginia Tech, and MBA in Marketing and New Venture Management at USC. I graduated at the top of my class, Phi Beta Kappa, Magna Cum Laude, Highest Honors, full fellowships, and more. I am an expert on:
I am originally from Milford Pennsylvania, but currently resided in the research triangle of North Carolina. I attended Boston College for my undergraduate education, majoring in Biochemistry and minoring in Medical Humanities. I attend Tufts University School of Medicine for my M.S. in Biomedical Sciences. Next year I will pursue my PhD at Duke University. I love helping tutor and work with students of all ages, helping them to improve their understanding of material and their grades/scores. I hope we can work together to help you achieve your goals.
I am a semi-retired adult who does not wish to sit idle. Instead, I prefer to plant good seeds into the lives of others. Further, I have discovered that I not only love to teach but that I am quite good at it.
I am familiar with learners of all shapes and sizes and can accomodate my style of teaching to best suit every student!
I am currently a physics major at the University of North Carolina at Chapel Hill. I have previously tutored at Mathnasium, teaching primarily middle school students with some elementary school students and some high school students. I primarily teach physics and math. I am very passionate about teaching, because I think every student has a different perspective. It is truly amazing how different students tend to think compared to adults, often displaying immense amounts of creativity, enthusiasm, and courage that most people could only dream of. It is important not to underestimate these qualities in young scholars, which is why I make it my goal to personally understand the students that I teach.
I am an undergraduate junior at the University of North Carolina at Chapel Hill majoring in statistics and chemistry. I have a passion for mentoring students, and I am excited to teach STEM-related subjects to those who want help. In my free time I like to watch sports, play table tennis, run, and read.
I am a currently a high school mathematics teacher. I graduated from the University of Richmond majoring in Business Administration with a concentration in Marketing Analytics and a minor in Mathematics. I have worked with kids of all ages, ranging from elementary school to college students through various subjects. I have also worked extensively with special needs children, doing everything from teaching special education to one-on-one in-home mentoring. Through my experiences, I have continued to carry my passion for working with children and have developed my skills in making successful and individualized learning fun. Math, science and test prep are the subjects I'm particularly passionate about tutoring, as I've always loved those subjects myself. Additionally, I've worked extensively with adults on business skills, marketing and social media.
Most students can plug numbers into a standard deviation formula — the harder part is interpreting what the result actually means in context. Joshitha approaches statistics by connecting every calculation to real-world reasoning: why a confidence interval narrows, what a p-value does and doesn't tell you. Her engineering background at Johns Hopkins means she uses statistical thinking constantly and can show students where these ideas live outside the textbook.
During her psychology degree at Penn, Brittany used statistics constantly — hypothesis testing, probability distributions, regression analysis — as core tools for understanding research. She also tutored middle schoolers in introductory statistics as a volunteer in West Philadelphia, so she's comfortable adjusting her explanations whether someone is learning mean and median or wrestling with p-values.
Emily's computational biology concentration at Cornell is essentially applied statistics — she uses probability distributions, confidence intervals, and regression analysis to interpret biological data every week. That hands-on context lets her explain statistical reasoning through concrete examples rather than abstract formulas.
A Quantitative Methods minor at Vanderbilt means Heather spent semesters immersed in regression analysis, hypothesis testing, and probability — the exact material that trips up most statistics students. She teaches the reasoning behind each test so students can choose the right method on their own, not just follow a decision flowchart. Her 4.9 rating speaks to that approach.
An economics degree means Maggie didn't just study statistics in a textbook — she applied distributions, hypothesis testing, and regression analysis to real datasets. She teaches students to interpret what a p-value actually tells them and how to choose the right test for a given scenario, building the kind of statistical intuition that carries through exams and research projects alike.
Most students walk into statistics expecting another math class and get blindsided by the emphasis on interpretation — explaining what a confidence interval actually means, or why correlation isn't causation. Amber tackles that interpretive layer head-on, teaching students to read context before crunching numbers. Her theater background gives her a knack for making abstract concepts like probability distributions feel concrete and memorable.
Studying Philosophy, Politics, and Economics at Penn means Kevin encounters statistics not as an abstract math course but as a tool for answering real questions — polling reliability, economic trends, policy evaluation. He unpacks topics like probability distributions, hypothesis testing, and regression with that applied lens. Students come away understanding not just how to compute a standard deviation but what it actually tells them.
Kathy's economics degree from Duke meant living inside datasets — regression analysis, probability distributions, hypothesis testing, and statistical inference were daily tools, not abstract concepts. She breaks down problems by connecting the math to what the numbers actually represent, which makes interpreting results feel intuitive rather than formulaic.
A biology degree from UIUC means Todd spent years designing experiments, interpreting data sets, and running statistical tests — skills he now brings directly to tutoring statistics. He unpacks concepts like probability distributions, hypothesis testing, and standard deviation by grounding them in real data scenarios rather than abstract formulas.
Probability distributions and hypothesis testing trip students up when the notation obscures what's conceptually straightforward. Kiran breaks statistical reasoning into concrete steps — what the data looks like, what question you're actually asking, and which test answers it — drawing on the data analysis skills he's built across his physics and computer science coursework.
Most students memorize the formulas for z-scores or standard deviation without ever seeing where they come from — Kathleen's math degree from Washington University means she can derive them from scratch and explain each piece along the way. She treats every statistics concept as an extension of the algebra and calculus her students already know, which makes new material feel like a logical next step rather than a disconnected set of rules.
Between her biostatistics background and hands-on research experience in Northwestern's John Rogers Lab, Ingrid knows statistics as both a classroom subject and a practical tool. She walks students through concepts like hypothesis testing, confidence intervals, and probability distributions by connecting each one to what the numbers actually mean in context.
Testimonials
Because the right Statistics tutor makes all the difference.
Average Session Rating – Based on 3.4M Learner Ratings
Practice Statistics
Free practice tests, flashcards, and AI tutoring for Statistics
Other Wilmington Tutors
Related Math Tutors in Wilmington
Frequently Asked Questions
Varsity Tutors matches Wilmington students with expert Statistics tutors for 1-on-1 instruction. We pair each student with a tutor based on their specific needs, learning style, and goals.
Whether you need homework help, exam prep, or want to get ahead, our Statistics tutors are ready to help.
Common challenges include gaps from earlier material, difficulty with specific concepts, and trouble applying learning to new problems. These issues can snowball quickly in Statistics.
A tutor identifies where you're stuck, fills in gaps, and provides targeted practice. The 1-on-1 format means you get help exactly where you need it.
Tutors work with your student's actual coursework—homework assignments, class notes, and upcoming tests. This keeps tutoring directly relevant to what's happening in the classroom.
When you share information about your student's school and curriculum, we can match you with a tutor who has relevant experience.
All tutors complete background checks, credential verification, and teaching evaluation. Many of our Statistics tutors hold advanced degrees or have years of teaching experience.
You can review tutor profiles to find someone with the right background for your student's level and needs.
Many students see improved grades within a few weeks, along with better understanding of Statistics concepts and more confidence tackling challenging material.
Tutors track progress and adjust their approach to ensure continued improvement.
Most students benefit from 1-2 sessions per week. More frequent sessions help if your student is significantly behind or has an important exam coming up.
Your tutor can recommend a schedule based on your student's specific situation and goals.
Tutoring is purchased in packages of hours, with rates varying by tutor experience. Varsity Tutors offers several options to fit different budgets and needs.
You can discuss pricing during your consultation to find what works best.
Your tutor will assess where your student is, discuss goals, and start working on priority areas. Most students bring current homework or upcoming test material to focus on.
By the end, you'll have a clear sense of how the tutor can help and a plan for moving forward.
Let’s find your perfect tutor
Answer a few quick questions. We’ll recommend the right plan and match you with a top 5% tutor.