Award-Winning Statistics Tutors
serving Milwaukee, WI
Statistics
Tutors in Milwaukee
Private 1-on-1 tutoring, weekly live classes for academic support, test prep & enrichment, practice tests and diagnostics, and more to elevate grades and test scores.
Based on 3.4M Learner Ratings
UniversitiesSchools & Universities
DeliveredHours Delivered
ProficiencyGrowth in Proficiency
Who needs tutoring?
No obligation. Takes ~1 minute.

Economics training is essentially applied statistics, so Ian brings a practical fluency to concepts like probability distributions, hypothesis testing, and regression analysis. He connects abstract formulas — z-scores, confidence intervals, p-values — to the kind of real data interpretation students will actually encounter in research or business contexts.
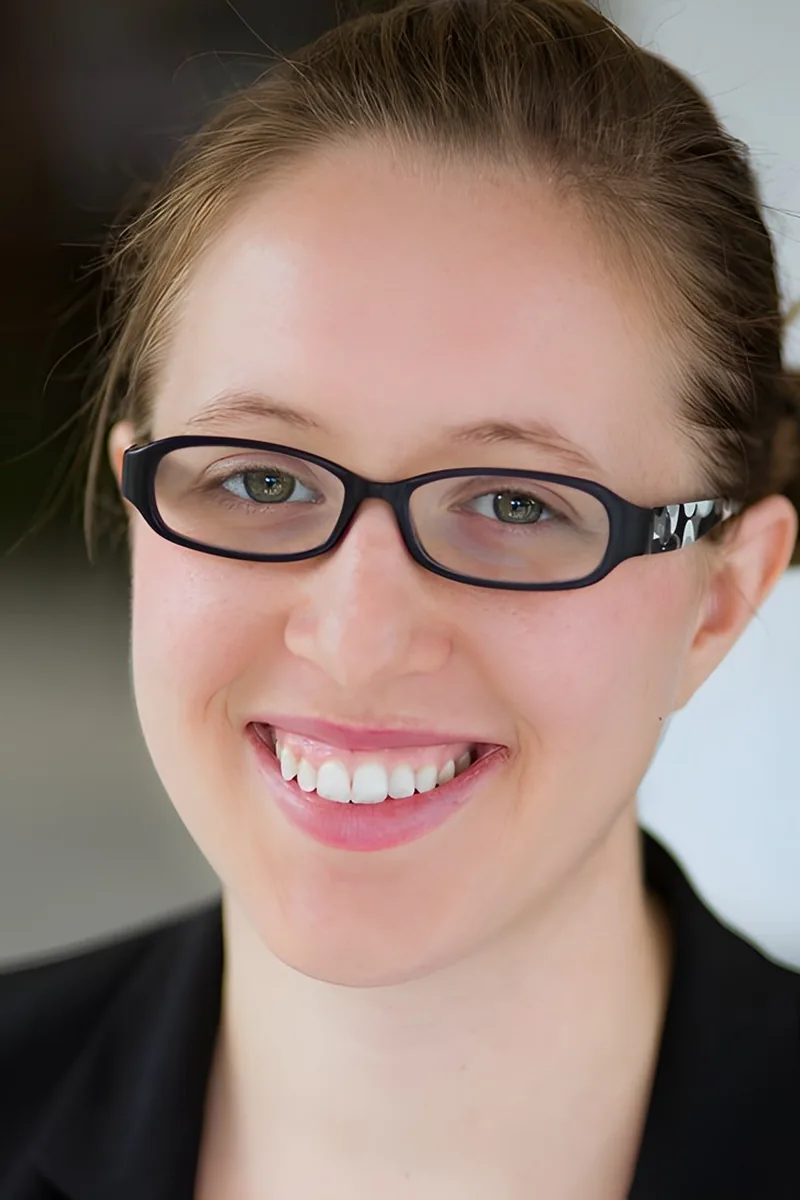
Most students walk into statistics expecting another math class and get blindsided by the emphasis on interpretation — explaining what a confidence interval actually means, or why correlation isn't causation. Amber tackles that interpretive layer head-on, teaching students to read context before crunching numbers. Her theater background gives her a knack for making abstract concepts like probability distributions feel concrete and memorable.
Megan earned her degree in Mathematics with a focus in Statistics from Washington University in St. Louis, then went deeper into data-driven decision-making during her MBA at UVA Darden — so she's used statistical methods on both the theoretical and applied sides. She unpacks concepts like probability models, variational analysis, and inference by connecting them to the economic and behavioral research questions she's studied across her math, econ, and psychology training. Rated 5.0 by students.
Studying Math/Stats at Carleton College means Thomas doesn't just teach statistics formulas — he understands the theory behind hypothesis testing, confidence intervals, and probability distributions at a level that lets him explain *why* a method works. He's especially sharp at translating word-heavy problems into the correct statistical setup, which is often the hardest part for students. Rated 5.0 by his students.
Standard deviation, confidence intervals, and p-values all describe the same underlying question — how much should we trust a pattern in data? — but textbooks rarely make that thread explicit. Aaron, who holds a PhD in mathematics and teaches statistics at the graduate level as well, connects the formulas to the probability theory underneath them so students can interpret results, not just compute them.
Psychology research runs on statistics — probability distributions, p-values, ANOVA, correlation versus causation — so Nicole didn't just study these topics in a textbook; she applied them to actual experimental data throughout her honors coursework. That applied lens makes her especially effective at teaching students who need to understand not just how to compute a standard deviation but what it actually tells them.
Probability distributions, regression analysis, and hypothesis testing all click faster when someone can explain the intuition behind the formulas. Connor is completing a double major in Applied Math and Finance at UW-Madison, so he regularly applies statistical reasoning to real datasets — and brings that practical fluency into every session. He holds a 5.0 rating from students.
Reading a dataset and knowing what story it tells — mean vs. median, standard deviation, probability distributions — requires a different kind of math thinking than most students are used to. Breanna's graduate-level research training gave her hands-on experience with statistical analysis, and she breaks down each concept using real-world examples that make the numbers meaningful.
Studying biology at the college level means living inside datasets — running chi-square tests on genetic crosses, interpreting p-values from lab experiments, and building regression models from field data. That daily immersion in applied statistics gives Jeffry a practical fluency with probability distributions, hypothesis testing, and confidence intervals that pure math coursework alone doesn't provide. Rated 4.9 by students.
Biochemistry lab work generates mountains of data — and Zach's coursework at UW-Madison means he's had to design experiments, run analyses, and make sense of variability in results firsthand. He breaks down concepts like standard deviation and sampling distributions by connecting them to the kinds of messy, real datasets students will actually encounter. Rated 5.0 by students.
Every week in her Industrial and Organizational Psychology program, Almira works with standard deviations, z-scores, and probability distributions to interpret real behavioral data. That daily fluency means she can explain statistical concepts through concrete examples — showing students what a p-value actually tells you, not just how to calculate one.
Engineering labs at Marquette require Brendan to design experiments, interpret distributions, and run hypothesis tests on real data sets, so he teaches statistics as a decision-making tool rather than a formula sheet. He digs into concepts like standard deviation, regression, and probability with an emphasis on understanding what the numbers actually tell you.
I am currently studying at Northwestern University, on the track to a Bachelor of Arts in Statistics with a double major in Mathematical Methods in the Social Sciences, which is just a fancy way of saying math-based economics, and a minor in Legal Studies as well as Marketing. After my undergraduate studies, I plan on working in consulting for a few years before attending law school. Finally, I hope to combine my law studies with my consulting work to become a well-rounded corporate lawyer. At Northwestern, I provide SAT tutoring to Chicago-area juniors and seniors. In high school, I tutored third through fifth graders in basic reading and writing skills and developed their interpersonal skills through group crafts and teamwork activities. While I am open to tutoring a broad range of subjects and tests, I am most passionate about Math, Statistics, Economics, and US History. In my experience helping students prepare for the SAT, I have found that interactive activities and group work really help! I am a firm believer in the work-hard-play-hard mindset and find it to be absolutely necessary for a balanced lifestyle, and I try to impart this appreciation to all of my students. While I encourage my students to keep up with their studies and work hard, I also believe that studying needs to be balanced out with interests and fun.
A year as a course assistant in Harvard's math department gave Richard a front-row seat to where students get tripped up — and in statistics, it's almost always the jump from computing a value to interpreting what it means. He teaches concepts like variability, correlation, and probability by connecting the math to the kind of data-driven arguments he encounters in his government coursework, where a misread confidence interval can derail an entire policy claim.
Yi's graduate training in research and experimental psychology required heavy use of statistical methods — from hypothesis testing and ANOVA to regression modeling and interpreting p-values in published studies. That hands-on experience with real data analysis means she teaches statistics as a tool for answering questions, not just a set of formulas to memorize.
Studying economics at Brown meant Carter lived inside datasets — running regressions, testing hypotheses, and interpreting distributions long before he started tutoring. That firsthand experience makes him especially effective at teaching concepts like standard deviation, normal models, and conditional probability in ways that feel grounded rather than abstract. He's rated 5.0 by students.
Studying cognitive science at Rice required Adam to run experiments, interpret data sets, and draw conclusions from statistical tests — so he teaches statistics as a practical reasoning tool, not just a math course. Whether it's regression analysis, p-values, or probability distributions, he connects each topic to real research questions that make the material intuitive.
A public policy background is surprisingly useful for teaching statistics — Noel spent his University of Chicago coursework interpreting real datasets, evaluating survey methodology, and distinguishing correlation from causation in policy research. He brings that same lens to topics like hypothesis testing, confidence intervals, and probability distributions, grounding abstract formulas in concrete examples that make the reasoning intuitive.
Between her sociology research in undergrad and her MBA coursework, Krupa has run enough regressions, hypothesis tests, and probability models to know exactly where students get tripped up. She tackles the conceptual side — why you'd choose a t-test over a z-test, what a p-value actually means — so the formulas stop feeling arbitrary. Her 4.9 rating speaks to how clearly she communicates these ideas.
Understanding when to use a t-test versus a z-test, or why a sampling distribution behaves the way it does, requires more than formula sheets — it takes genuine statistical intuition. Brian built that intuition through his economics coursework at Caltech, where statistical analysis was a daily tool, and he walks students through each concept with concrete data examples.
Engineering Physics at Cornell requires serious statistical reasoning — error analysis, probability distributions, hypothesis testing — so Daniel brings a practical lens to statistics rather than a purely textbook one. He walks through concepts like standard deviation, regression, and confidence intervals by tying them to real data questions, which makes the logic behind each formula click.
Kathy's economics degree from Duke meant living inside datasets — regression analysis, probability distributions, hypothesis testing, and statistical inference were daily tools, not abstract concepts. She breaks down problems by connecting the math to what the numbers actually represent, which makes interpreting results feel intuitive rather than formulaic.
Understanding when to use a standard deviation versus an interquartile range — or why a skewed distribution changes your entire analysis — requires more than formula memorization. Vinson approaches statistics through data interpretation first, walking through probability distributions, hypothesis testing, and regression with an emphasis on what the numbers actually tell you. He's studying computational math at Rice, where statistical reasoning is woven into his daily coursework.
Kaylah's graduate work in Computational Social Science at the University of Chicago is built almost entirely on statistical methods — probability distributions, hypothesis testing, regression modeling, and data interpretation. She teaches statistics the way she actually uses it: starting with what question you're trying to answer, then selecting and applying the right tool. Her background in cognitive neuroscience research means every example she pulls from is grounded in real data.
Probability distributions, hypothesis testing, and regression analysis each require a different kind of thinking — and Rahi distinguishes clearly between the conceptual reasoning and the mechanical calculation so students know which skill a problem is actually testing. His applied mathematics background means he can explain the logic behind formulas like the Central Limit Theorem instead of just handing students a recipe to follow.
Testimonials
Because the right Statistics tutor makes all the difference.
Average Session Rating – Based on 3.4M Learner Ratings
Practice Statistics
Free practice tests, flashcards, and AI tutoring for Statistics
Nearby Statistics Tutors
Other Milwaukee Tutors
Related Math Tutors in Milwaukee
Frequently Asked Questions
Statistics requires both conceptual understanding and practical application—students need to grasp why methods work, not just memorize formulas. Many students struggle with interpreting data, understanding probability concepts, and translating real-world problems into statistical analyses. Personalized tutoring helps students move beyond procedural steps to see the underlying patterns and connections that make Statistics click.
Students often struggle with probability concepts, hypothesis testing, and distinguishing between correlation and causation. Word problems that require setting up statistical tests can feel overwhelming, and many students find it hard to interpret confidence intervals, p-values, and statistical significance in real-world contexts. Tutoring addresses these gaps by breaking down complex concepts and showing how statistical thinking applies to actual data and decision-making.
The first session focuses on understanding your current level, identifying specific challenges, and establishing goals. A tutor will review the concepts you're working on, assess where misconceptions exist, and create a personalized plan tailored to your learning style. This foundation ensures that every subsequent session builds on your strengths and directly addresses the areas where you need the most support.
Yes. Varsity Tutors connects you with tutors who understand different Statistics curricula and textbooks used across Milwaukee's 16 school districts. Whether you're using AP Statistics, IB Statistics, college-level Statistics, or a specific textbook approach, tutors can align instruction with your course requirements and pacing. This ensures tutoring reinforces what you're learning in class while filling gaps in understanding.
Many Statistics problems require clear communication of reasoning—from setting up hypotheses to interpreting results. Tutors teach you how to organize your work logically, label each step, and explain your statistical decisions in ways that demonstrate understanding rather than just getting an answer. This skill is especially important for exams and assignments where partial credit depends on showing your thinking process.
Absolutely. Statistics anxiety often stems from feeling lost in unfamiliar concepts or struggling with word problems. Working 1-on-1 with a tutor builds confidence by breaking intimidating topics into manageable pieces and celebrating progress along the way. As you develop a stronger conceptual foundation and see patterns in how different statistical methods connect, the subject becomes less daunting and more intuitive.
Tutors help you see Statistics not as abstract formulas, but as tools for answering real questions about data. Whether it's understanding polling accuracy, evaluating medical studies, or analyzing business trends, connecting concepts to concrete examples makes Statistics more meaningful and memorable. This approach also prepares you for college and careers where statistical thinking is essential.
Varsity Tutors matches you with qualified tutors based on your specific needs, schedule, and learning goals. Simply share details about your Statistics course, current challenges, and what you're hoping to achieve, and we'll connect you with an expert tutor who fits your situation. Most students start seeing improvement within the first few sessions as personalized instruction targets exactly what you need.
Let’s find your perfect tutor
Answer a few quick questions. We’ll recommend the right plan and match you with a top 5% tutor.