Award-Winning Statistics Tutors
serving Hartford, CT
Statistics
Tutors in Hartford
Private 1-on-1 tutoring, weekly live classes for academic support, test prep & enrichment, practice tests and diagnostics, and more to elevate grades and test scores.
Based on 3.4M Learner Ratings
UniversitiesSchools & Universities
DeliveredHours Delivered
ProficiencyGrowth in Proficiency
Who needs tutoring?
No obligation. Takes ~1 minute.

Probability distributions, hypothesis testing, and regression can feel like a foreign language the first time through. Nina breaks these concepts down by connecting them to real datasets and research questions drawn from her biostatistics training at Columbia and NYU. Rated 5.0 by students, she's especially effective at making the jump from formulas to interpretation feel intuitive.
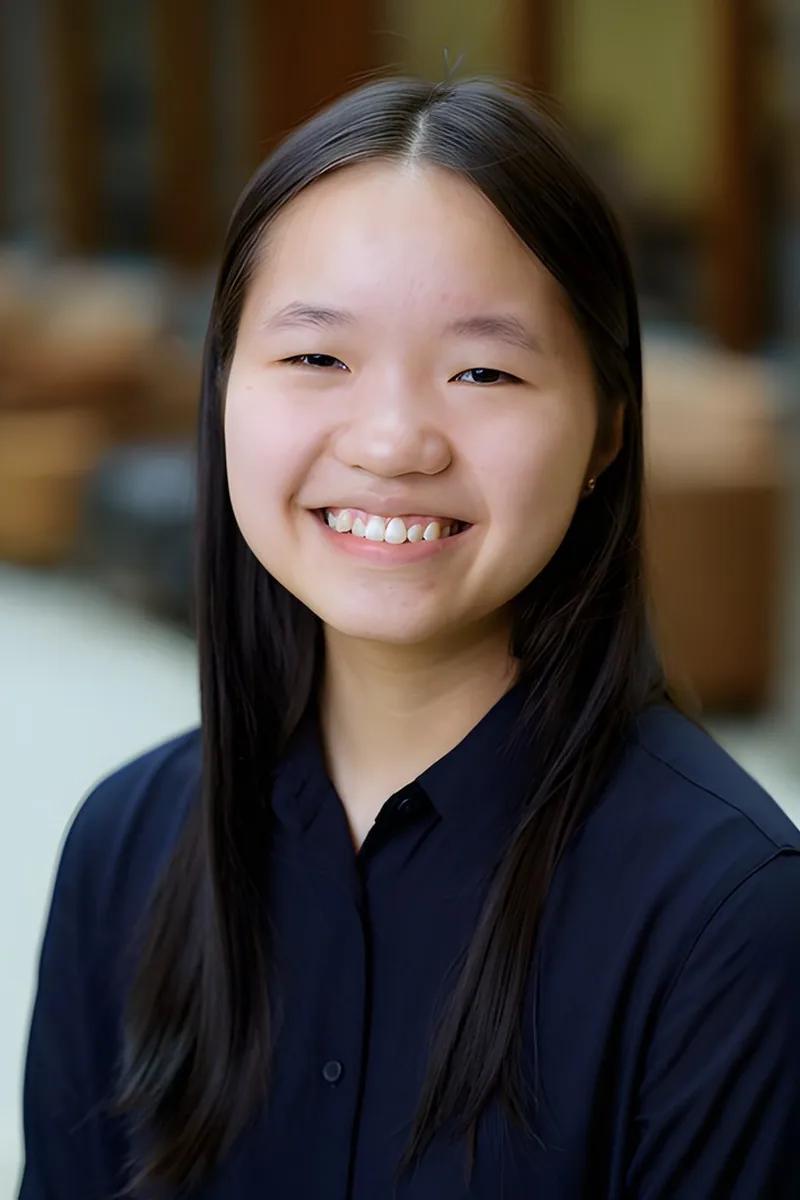
Between her biostatistics background and hands-on research experience in Northwestern's John Rogers Lab, Ingrid knows statistics as both a classroom subject and a practical tool. She walks students through concepts like hypothesis testing, confidence intervals, and probability distributions by connecting each one to what the numbers actually mean in context.
A PhD statistician who also holds a biomedical engineering degree, Sam teaches introductory and intermediate statistics with an unusual amount of real-world context. Whether the topic is hypothesis testing, confidence intervals, or regression, he unpacks the logic behind each method so students can interpret results critically, not just run calculations.
Studying Philosophy, Politics, and Economics at Penn means Kevin encounters statistics not as an abstract math course but as a tool for answering real questions — polling reliability, economic trends, policy evaluation. He unpacks topics like probability distributions, hypothesis testing, and regression with that applied lens. Students come away understanding not just how to compute a standard deviation but what it actually tells them.
Kathy's economics degree from Duke meant living inside datasets — regression analysis, probability distributions, hypothesis testing, and statistical inference were daily tools, not abstract concepts. She breaks down problems by connecting the math to what the numbers actually represent, which makes interpreting results feel intuitive rather than formulaic.
Understanding when to use a t-test versus a z-test, or why a sampling distribution behaves the way it does, requires more than formula sheets — it takes genuine statistical intuition. Brian built that intuition through his economics coursework at Caltech, where statistical analysis was a daily tool, and he walks students through each concept with concrete data examples.
Most students walk into statistics expecting another math class and get blindsided by the emphasis on interpretation — explaining what a confidence interval actually means, or why correlation isn't causation. Amber tackles that interpretive layer head-on, teaching students to read context before crunching numbers. Her theater background gives her a knack for making abstract concepts like probability distributions feel concrete and memorable.
An economics degree means Maggie didn't just study statistics in a textbook — she applied distributions, hypothesis testing, and regression analysis to real datasets. She teaches students to interpret what a p-value actually tells them and how to choose the right test for a given scenario, building the kind of statistical intuition that carries through exams and research projects alike.
A year as a course assistant in Harvard's math department gave Richard a front-row seat to where students get tripped up — and in statistics, it's almost always the jump from computing a value to interpreting what it means. He teaches concepts like variability, correlation, and probability by connecting the math to the kind of data-driven arguments he encounters in his government coursework, where a misread confidence interval can derail an entire policy claim.
Engineering at Dartmouth meant Rachel lived in data — running experiments, interpreting distributions, and making decisions based on probability and hypothesis testing. She brings that practical fluency to statistics tutoring, connecting concepts like standard deviation and confidence intervals to real scenarios instead of leaving them as abstract formulas.
Designing and optimizing light filters for optical multiplexers at Norfolk State required Dennis to apply statistical methods to real engineering data — fitting distributions, quantifying uncertainty, and interpreting experimental results. He teaches statistics with that practitioner's perspective, making topics like standard deviation, probability, and regression feel like problem-solving tools rather than abstract formulas.
Probability distributions, hypothesis testing, and confidence intervals all require a kind of careful reasoning about uncertainty that Allen sharpened through his economics coursework at Yale. He teaches statistics as a way of making arguments with data — interpreting p-values, choosing the right test, and understanding what a result actually means in context. His 5.0 rating speaks to how clearly he communicates these ideas.
Probability distributions, hypothesis testing, and regression analysis are central to both engineering and business — and Caroline has graduate-level training in both. Her mechanical engineering M.S. from WashU built her statistical modeling skills, while her current MBA at MIT Sloan sharpens how she interprets data for real-world decisions. She teaches the reasoning behind each method so formulas stop feeling like black boxes.
Most students memorize the formulas for z-scores or standard deviation without ever seeing where they come from — Kathleen's math degree from Washington University means she can derive them from scratch and explain each piece along the way. She treats every statistics concept as an extension of the algebra and calculus her students already know, which makes new material feel like a logical next step rather than a disconnected set of rules.
Interpreting p-values, choosing the right hypothesis test, and knowing when a confidence interval actually tells you something useful — these are the concepts that separate students who understand statistics from those just plugging into calculators. Zachary brings a researcher's perspective from his biochemistry and biophysics training, where statistical analysis was built into every experiment. Rated 5.0 by students.
Probability distributions, hypothesis testing, and regression analysis all clicked for Sami during his economics work at Duke, where statistical reasoning was baked into nearly every course. Now pursuing an MBA at Yale, he still uses these tools daily and teaches students to interpret data with genuine intuition — understanding what a p-value actually means, not just when to reject a null hypothesis.
Kaylah's graduate work in Computational Social Science at the University of Chicago is built almost entirely on statistical methods — probability distributions, hypothesis testing, regression modeling, and data interpretation. She teaches statistics the way she actually uses it: starting with what question you're trying to answer, then selecting and applying the right tool. Her background in cognitive neuroscience research means every example she pulls from is grounded in real data.
A PhD in economics at Yale means Anthony doesn't just teach statistics — he relies on it daily, from econometric modeling to designing empirical studies that require careful handling of inference, sampling, and regression. His dual undergraduate background in physics and math gives him an unusual ability to trace statistical methods back to their mathematical roots, making concepts like maximum likelihood estimation or the central limit theorem genuinely intuitive. Rated 5.0 by students.
During her psychology degree at Penn, Brittany used statistics constantly — hypothesis testing, probability distributions, regression analysis — as core tools for understanding research. She also tutored middle schoolers in introductory statistics as a volunteer in West Philadelphia, so she's comfortable adjusting her explanations whether someone is learning mean and median or wrestling with p-values.
Understanding statistics means learning to think critically about variability, probability, and what data can actually tell you. Tashina applies statistical methods daily in her PhD research in brain sciences — hypothesis testing, confidence intervals, regression — and she unpacks each concept by connecting it to the kind of real analysis questions that make the material stick.
Running regression analyses, interpreting p-values, and choosing between parametric and nonparametric tests are things Martha does routinely in her social psychology research at Michigan. That hands-on fluency means she can explain not just how to compute a standard deviation or set up a hypothesis test, but why each step matters and what the results actually tell you. Rated 5.0 by students.
Probability distributions, hypothesis testing, and regression analysis all click faster when you've actually used them to make decisions. Hari's finance background means he's applied statistical methods to real datasets — forecasting, risk analysis, variance modeling — and he teaches the logic behind each test so students can choose the right approach on their own.
Emily's computational biology concentration at Cornell is essentially applied statistics — she uses probability distributions, confidence intervals, and regression analysis to interpret biological data every week. That hands-on context lets her explain statistical reasoning through concrete examples rather than abstract formulas.
A biology degree from UIUC means Todd spent years designing experiments, interpreting data sets, and running statistical tests — skills he now brings directly to tutoring statistics. He unpacks concepts like probability distributions, hypothesis testing, and standard deviation by grounding them in real data scenarios rather than abstract formulas.
As a Statistics major at Northwestern, Jake lives in this material daily — regression analysis, probability distributions, confidence intervals, and hypothesis testing are part of his coursework, not just something he once studied for a test. That proximity to the subject means he explains concepts with the kind of fluency that comes from constant use. He holds a 5.0 client rating.
Studying economics at Brown meant Carter lived inside datasets — running regressions, testing hypotheses, and interpreting distributions long before he started tutoring. That firsthand experience makes him especially effective at teaching concepts like standard deviation, normal models, and conditional probability in ways that feel grounded rather than abstract. He's rated 5.0 by students.
Graduating from an IB high school with top marks and then completing a math degree at Brown means Zofia encountered statistics from both sides — the structured hypothesis testing and chi-square analyses of the IB curriculum, and the rigorous probability theory that underpins it all at the university level. She breaks down concepts like conditional probability and sampling distributions by connecting them to the mathematical machinery students rarely get to see in a standard stats course. Her 3.87 GPA in a demanding program speaks to the precision she brings to every session.
Probability distributions, hypothesis testing, and confidence intervals require a different kind of mathematical thinking than most students are used to. Nicholas pairs his applied mathematics background at Johns Hopkins with real problem-solving instincts, teaching students to interpret what a p-value actually means and when to apply which test. He's especially effective at connecting statistical reasoning to the kind of data analysis students encounter in science and engineering contexts.
Engineering Physics at Cornell requires serious statistical reasoning — error analysis, probability distributions, hypothesis testing — so Daniel brings a practical lens to statistics rather than a purely textbook one. He walks through concepts like standard deviation, regression, and confidence intervals by tying them to real data questions, which makes the logic behind each formula click.
A public policy background is surprisingly useful for teaching statistics — Noel spent his University of Chicago coursework interpreting real datasets, evaluating survey methodology, and distinguishing correlation from causation in policy research. He brings that same lens to topics like hypothesis testing, confidence intervals, and probability distributions, grounding abstract formulas in concrete examples that make the reasoning intuitive.
Working as a research assistant in Yale's cognitive neuroscience lab meant Emily ran statistical analyses regularly — hypothesis testing, probability distributions, and interpreting p-values were part of her daily routine. That hands-on experience makes her especially effective at explaining why a statistical method works, not just how to execute it on a calculator.
Probability distributions, hypothesis testing, and regression analysis each require a different kind of thinking — and Rahi distinguishes clearly between the conceptual reasoning and the mechanical calculation so students know which skill a problem is actually testing. His applied mathematics background means he can explain the logic behind formulas like the Central Limit Theorem instead of just handing students a recipe to follow.
Probability distributions, hypothesis testing, and regression analysis all require a kind of structured thinking that Florence sharpened through her computer science degree at Duke. She teaches statistics by grounding each concept in real data scenarios — building intuition for what a p-value actually means before diving into formulas. Her 5.0 client rating speaks to how well that approach lands.
Jonathan holds an MS in Statistics, which means probability distributions, hypothesis testing, and regression analysis aren't just textbook topics for him — they're the core of his graduate training. He breaks down intimidating formulas like Bayes' theorem or ANOVA tables by connecting them to the real-world questions they were designed to answer.
Most students can plug numbers into a standard deviation formula — the harder part is interpreting what the result actually means in context. Joshitha approaches statistics by connecting every calculation to real-world reasoning: why a confidence interval narrows, what a p-value does and doesn't tell you. Her engineering background at Johns Hopkins means she uses statistical thinking constantly and can show students where these ideas live outside the textbook.
Between her sociology research in undergrad and her MBA coursework, Krupa has run enough regressions, hypothesis tests, and probability models to know exactly where students get tripped up. She tackles the conceptual side — why you'd choose a t-test over a z-test, what a p-value actually means — so the formulas stop feeling arbitrary. Her 4.9 rating speaks to how clearly she communicates these ideas.
A Quantitative Methods minor at Vanderbilt means Heather spent semesters immersed in regression analysis, hypothesis testing, and probability — the exact material that trips up most statistics students. She teaches the reasoning behind each test so students can choose the right method on their own, not just follow a decision flowchart. Her 4.9 rating speaks to that approach.
The hardest part of statistics for most students isn't the math — it's interpreting what a p-value or confidence interval actually means in context. Vy's training in cognitive studies at Vanderbilt, which is heavily research-methods driven, means she's spent real time designing studies and running analyses. She unpacks concepts like distributions, hypothesis testing, and regression by tying them to concrete research questions.
A political science degree from Brown meant Lyall spent years interpreting polling data, regression models, and probability distributions in real research contexts. He brings that applied lens to statistics tutoring, connecting concepts like standard deviation and confidence intervals to situations where the numbers actually matter. Students get someone who treats stats as a tool for making arguments, not just a formula sheet to memorize.
Studying Comparative Human Development at the doctoral level means Gabriel has spent years designing studies, interpreting data sets, and running statistical analyses firsthand. He teaches statistics by grounding concepts like probability distributions, hypothesis testing, and regression in real research questions rather than abstract formulas. That practical lens makes the subject click for students who struggle with the textbook approach.
Testimonials
Because the right Statistics tutor makes all the difference.
Average Session Rating – Based on 3.4M Learner Ratings
Practice Statistics
Free practice tests, flashcards, and AI tutoring for Statistics
Nearby Statistics Tutors
Other Hartford Tutors
Related Math Tutors in Hartford
Frequently Asked Questions
Statistics requires both conceptual understanding and practical application—students often struggle with interpreting what statistical measures actually mean rather than just calculating them. Common pain points include understanding probability concepts, working with data distributions, hypothesis testing, and translating real-world scenarios into statistical problems. Many students also find it challenging to recognize which statistical method applies to a given situation, which is where personalized instruction can help clarify the underlying logic.
While Algebra focuses on solving equations and manipulating expressions, Statistics emphasizes data interpretation, probability reasoning, and drawing conclusions from evidence. This shift from procedural problem-solving to conceptual thinking can be jarring for students who excelled in Algebra. Tutors experienced in Statistics help students build this new way of thinking by connecting abstract concepts to real data and showing why certain methods work, rather than just how to perform calculations.
Your first session is focused on understanding where you are and what you need most. A tutor will likely review recent coursework, identify specific topics causing confusion, and assess whether challenges stem from calculation skills, conceptual gaps, or test anxiety. This personalized assessment helps the tutor create a targeted plan for your next sessions, whether that's building foundational probability concepts, mastering data analysis techniques, or developing problem-solving strategies.
Word problems require students to translate real-world language into statistical concepts and methods—a skill that's often overlooked in traditional instruction. Tutors help by breaking down the problem-solving process: identifying what data you have, determining what you're being asked to find, selecting the appropriate statistical tool, and interpreting results in context. Through guided practice with multiple problem types, students develop pattern recognition and confidence in tackling unfamiliar scenarios.
Yes—Hartford's 10 school districts may use different textbooks and approaches to Statistics, and tutors connected through Varsity Tutors are experienced working across various curricula and standards. Whether your course emphasizes traditional methods, technology-based analysis, or AP Statistics content, a tutor can align their instruction with your specific course materials and learning objectives. This ensures the strategies you learn directly support your classwork and assessments.
Statistics anxiety is common because it combines calculation, interpretation, and reasoning—but personalized instruction breaks this down into manageable pieces. Working 1-on-1 with a tutor creates a low-pressure environment where you can ask questions freely, work through problems at your own pace, and build confidence through success. Tutors also help reframe Statistics as a logical toolkit rather than mysterious formulas, which shifts students' mindset from "I can't do this" to "I'm learning how to think about data."
Varsity Tutors connects you with tutors who have expertise in Statistics and understand the specific challenges students face with the subject. When you reach out, you can share details about your course, current struggles, and learning style—this helps ensure you're matched with someone experienced in the areas you need most. Many students benefit from a tutor who can explain concepts multiple ways and adapt their teaching to how you learn best.
Many students notice improved understanding and confidence within 3-4 sessions, especially when tutoring targets specific gaps like probability concepts or hypothesis testing. However, Statistics is cumulative—building strong conceptual foundations takes time, and consistent practice between sessions accelerates progress. The timeline depends on where you're starting and your goals, but personalized instruction helps you see patterns and connections much faster than working alone, which builds both skill and confidence.
Let’s find your perfect tutor
Answer a few quick questions. We’ll recommend the right plan and match you with a top 5% tutor.