Award-Winning Statistics Tutors
serving New Haven, CT
Statistics
Tutors in New Haven
Private 1-on-1 tutoring, weekly live classes for academic support, test prep & enrichment, practice tests and diagnostics, and more to elevate grades and test scores.
Based on 3.4M Learner Ratings
UniversitiesSchools & Universities
DeliveredHours Delivered
ProficiencyGrowth in Proficiency
Who needs tutoring?
No obligation. Takes ~1 minute.

A PhD in economics at Yale means Anthony doesn't just teach statistics — he relies on it daily, from econometric modeling to designing empirical studies that require careful handling of inference, sampling, and regression. His dual undergraduate background in physics and math gives him an unusual ability to trace statistical methods back to their mathematical roots, making concepts like maximum likelihood estimation or the central limit theorem genuinely intuitive. Rated 5.0 by students.
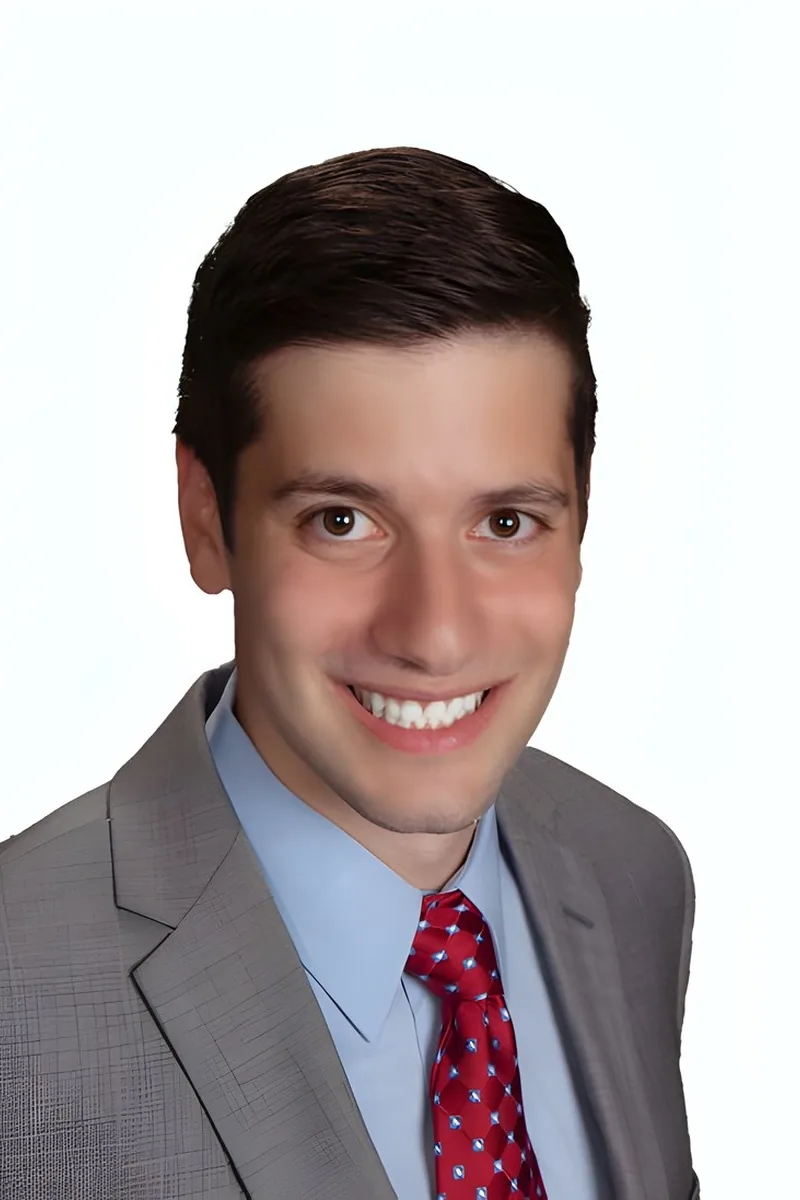
Probability distributions, hypothesis testing, and regression analysis all clicked for Sami during his economics work at Duke, where statistical reasoning was baked into nearly every course. Now pursuing an MBA at Yale, he still uses these tools daily and teaches students to interpret data with genuine intuition — understanding what a p-value actually means, not just when to reject a null hypothesis.
Understanding statistics means learning to ask the right questions about data before running any test: Is the sample random? What's the shape of the distribution? Could this result have happened by chance? Ethan's policy background gave him years of practice interrogating datasets and translating statistical output into plain-language conclusions, a skill he now brings directly to topics like hypothesis testing and regression analysis.
What separates a strong statistics student from a struggling one usually isn't computation — it's grasping why a particular test or measure fits a particular question. Tessa's mathematics coursework at Yale, paired with her history training where she regularly evaluates quantitative evidence in primary sources, gives her a sharp eye for the reasoning behind tools like confidence intervals and hypothesis tests. Rated 4.9 by students.
Probability distributions, hypothesis testing, confidence intervals — statistics asks students to reason about uncertainty, which doesn't come naturally to most people. Joshua approaches each concept by building the logic behind it first, so formulas feel like conclusions rather than things to memorize.
Econometrics at UChicago forced Alex to live inside probability distributions, hypothesis testing, and regression analysis at a level most statistics students never reach. That depth means he can explain concepts like p-values or confidence intervals with real intuition about what the numbers actually mean. He's currently doing research at UChicago that relies on statistical methods every day.
Running study groups in college-level business statistics gave Bradley a sharp sense of where students get stuck — usually somewhere between understanding a concept intuitively and translating it into the right formula or notation. He tackles topics like regression analysis, hypothesis testing, and probability by grounding each one in practical examples from business and everyday decision-making. His Babson coursework keeps these methods fresh and applied.
I'm a curious person, an avid guitar player, and a dedicated Wikipedia reader. I currently am in the process of learning piano, stock trading, machine learning, and the basics of Python programming. I also like playing video games with friends, reading, listening to (and attempting to make) music, and traveling.
Hello, my name is Yosef and I would be happy to serve as a math tutor. I place strong emphasis on a good balance between knowledge of mathematical content and proficiency in problem-solving, reasoning, and conveying mathematical ideas in writing. There are times when a student needs to be informed of a solution, times when he or she also needs to hear the explanation of why the solution works, and times when he or she should be guided to finding the solution on his or her own. It is important for the tutor to recognize which approach is appropriate. Frequently, when students struggle, it is because they do not understand the notation or terminology in use. In such cases, it is important to reassure the student, reminding him or her that he or she is only struggling with understanding a single word, not the entire mathematical concept. As a rule, people perform better and are better motivated when they have self-confidence, not when the task ahead seems frighteningly daunting. It is also important to recognize that different students learn best through different means. As an example, some students are visual learners and can understand the material best through pictures and gestures. Other students learn best through hearing the procedures vocalized, while still others learn best through writing out the steps of the solution procedure. I know to adapt my teaching style to the individual student. with these considerations in mind, I promise to provide the best assistance that I can, taking your individual needs into consideration.
Understanding probability distributions or interpreting a confidence interval requires a different kind of thinking than most math classes demand. Dillon spent years applying statistics in engineering contexts — quality control, data analysis, experimental design — and he brings that applied lens to topics like standard deviation, z-scores, and regression so students see what the numbers actually tell them.
Probability distributions, hypothesis testing, and confidence intervals all require a kind of careful reasoning about uncertainty that Allen sharpened through his economics coursework at Yale. He teaches statistics as a way of making arguments with data — interpreting p-values, choosing the right test, and understanding what a result actually means in context. His 5.0 rating speaks to how clearly he communicates these ideas.
Probability distributions, hypothesis testing, and regression analysis click faster when a tutor can show where these tools get deployed in practice. Firas uses statistics daily in his machine learning research at Princeton, which means he can walk through concepts like Bayesian inference or p-values with real datasets and concrete examples instead of abstract formulas.
Emily's computational biology concentration at Cornell is essentially applied statistics — she uses probability distributions, confidence intervals, and regression analysis to interpret biological data every week. That hands-on context lets her explain statistical reasoning through concrete examples rather than abstract formulas.
Studying economics at the undergraduate level means living inside probability distributions, hypothesis tests, and regression models — so Laura treats statistics as a language she already speaks fluently. She breaks down concepts like p-values and confidence intervals by tying them to concrete decision-making scenarios rather than abstract formulas. Her 5.0 rating speaks to how clearly that approach translates for students.
A political science degree from Brown meant Lyall spent years interpreting polling data, regression models, and probability distributions in real research contexts. He brings that applied lens to statistics tutoring, connecting concepts like standard deviation and confidence intervals to situations where the numbers actually matter. Students get someone who treats stats as a tool for making arguments, not just a formula sheet to memorize.
Studying Philosophy, Politics, and Economics at Penn means Kevin encounters statistics not as an abstract math course but as a tool for answering real questions — polling reliability, economic trends, policy evaluation. He unpacks topics like probability distributions, hypothesis testing, and regression with that applied lens. Students come away understanding not just how to compute a standard deviation but what it actually tells them.
Probability distributions, hypothesis testing, and confidence intervals require a different kind of mathematical thinking than most students are used to. Nicholas pairs his applied mathematics background at Johns Hopkins with real problem-solving instincts, teaching students to interpret what a p-value actually means and when to apply which test. He's especially effective at connecting statistical reasoning to the kind of data analysis students encounter in science and engineering contexts.
Understanding when to use a standard deviation versus an interquartile range — or why a skewed distribution changes your entire analysis — requires more than formula memorization. Vinson approaches statistics through data interpretation first, walking through probability distributions, hypothesis testing, and regression with an emphasis on what the numbers actually tell you. He's studying computational math at Rice, where statistical reasoning is woven into his daily coursework.
Studying mathematical economic analysis means Kenan lives in the world of probability distributions, hypothesis testing, and regression — the exact toolkit a statistics course demands. He unpacks concepts like p-values and confidence intervals by tying each one to a concrete decision it would inform, so the reasoning sticks long after the formula sheet is gone.
Probability distributions, hypothesis testing, and regression analysis all require a kind of structured thinking that Florence sharpened through her computer science degree at Duke. She teaches statistics by grounding each concept in real data scenarios — building intuition for what a p-value actually means before diving into formulas. Her 5.0 client rating speaks to how well that approach lands.
Studying conducting at Juilliard means Molly lives in data — analyzing scores, interpreting patterns, and making decisions based on complex information. She brings that same analytical mindset to statistics, breaking down probability distributions, hypothesis testing, and data interpretation into logical steps. Her 5.0 client rating speaks to how clearly she communicates even the trickiest concepts.
Testimonials
Because the right Statistics tutor makes all the difference.
Average Session Rating – Based on 3.4M Learner Ratings
Practice Statistics
Free practice tests, flashcards, and AI tutoring for Statistics
Nearby Statistics Tutors
Other New Haven Tutors
Related Math Tutors in New Haven
Frequently Asked Questions
Statistics requires both conceptual understanding and practical application—students often memorize formulas without grasping why they work or when to use them. Common challenges include interpreting data visualizations, understanding probability concepts, designing experiments, and translating real-world problems into statistical questions. Many students also feel anxious about the mathematical reasoning involved, which can hold them back from engaging deeply with the material.
During an initial session, a tutor will assess your current understanding of Statistics concepts, identify specific areas where you're struggling (whether that's hypothesis testing, regression, or data interpretation), and learn about your learning style and goals. This helps create a personalized plan that addresses your unique challenges and builds confidence in the subject.
Expert tutors help you move beyond memorizing formulas by showing you the reasoning behind statistical methods—why we use standard deviation, what a p-value actually means, and how different tests connect to real-world questions. This deeper understanding makes it easier to solve unfamiliar problems and apply Statistics in new contexts, rather than relying on rote memorization.
Word problems require translating English into statistical language—identifying what data you have, what question you're answering, and which method to use. Tutors teach you strategies for breaking down complex problems into steps, recognizing patterns in problem types, and checking whether your answer makes sense in context. With practice and guidance, word problems become much less intimidating.
Yes. New Haven schools use different Statistics programs and approaches, and tutors are experienced working across various curricula—whether you're using AP Statistics, IB Statistics, college-level Statistics, or other frameworks. Tutors align their instruction with your specific course materials and expectations, ensuring you're prepared for your classroom assessments.
Absolutely. Math anxiety is common, especially in Statistics where abstract concepts and unfamiliar notation can feel overwhelming. Tutors create a low-pressure environment where you can ask questions, work through problems at your own pace, and build confidence through small wins. As you understand concepts more deeply, anxiety typically decreases.
Interpreting graphs requires understanding what different visual elements represent and what patterns or outliers tell us about data. Tutors teach you to read graphs systematically, ask critical questions about what data is shown (and what's missing), and connect visual patterns to statistical concepts like correlation, distribution, and variability. Regular practice with real-world data makes this skill intuitive.
Varsity Tutors matches you with expert Statistics tutors who understand your specific needs and learning style. You can start by telling us about your current challenges, whether you're preparing for an exam or working to improve your grade in class. We'll connect you with a tutor who can provide personalized 1-on-1 instruction tailored to your goals.
Let’s find your perfect tutor
Answer a few quick questions. We’ll recommend the right plan and match you with a top 5% tutor.