Award-Winning Statistics Tutors
serving Denver, CO
Statistics
Tutors in Denver
Private 1-on-1 tutoring, weekly live classes for academic support, test prep & enrichment, practice tests and diagnostics, and more to elevate grades and test scores.
Based on 3.4M Learner Ratings
UniversitiesSchools & Universities
DeliveredHours Delivered
ProficiencyGrowth in Proficiency
Who needs tutoring?
No obligation. Takes ~1 minute.
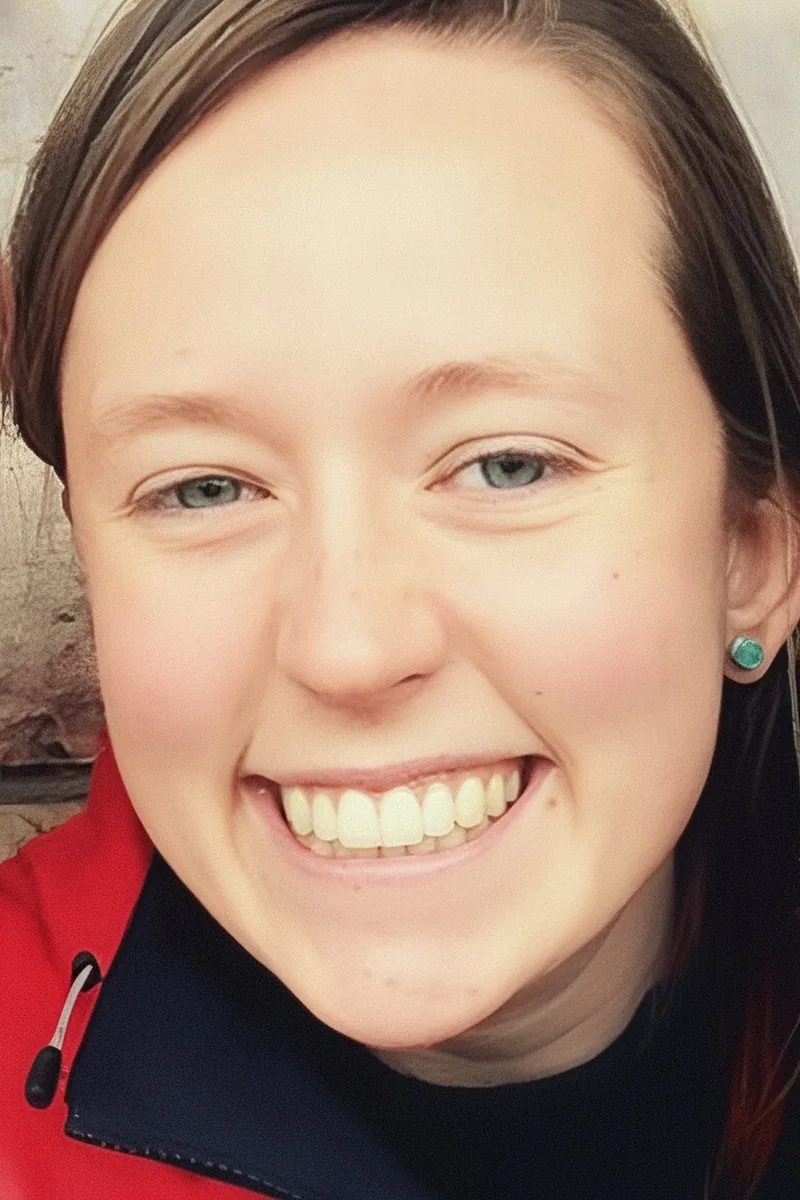
Graduating from an IB high school with top marks and then completing a math degree at Brown means Zofia encountered statistics from both sides — the structured hypothesis testing and chi-square analyses of the IB curriculum, and the rigorous probability theory that underpins it all at the university level. She breaks down concepts like conditional probability and sampling distributions by connecting them to the mathematical machinery students rarely get to see in a standard stats course. Her 3.87 GPA in a demanding program speaks to the precision she brings to every session.
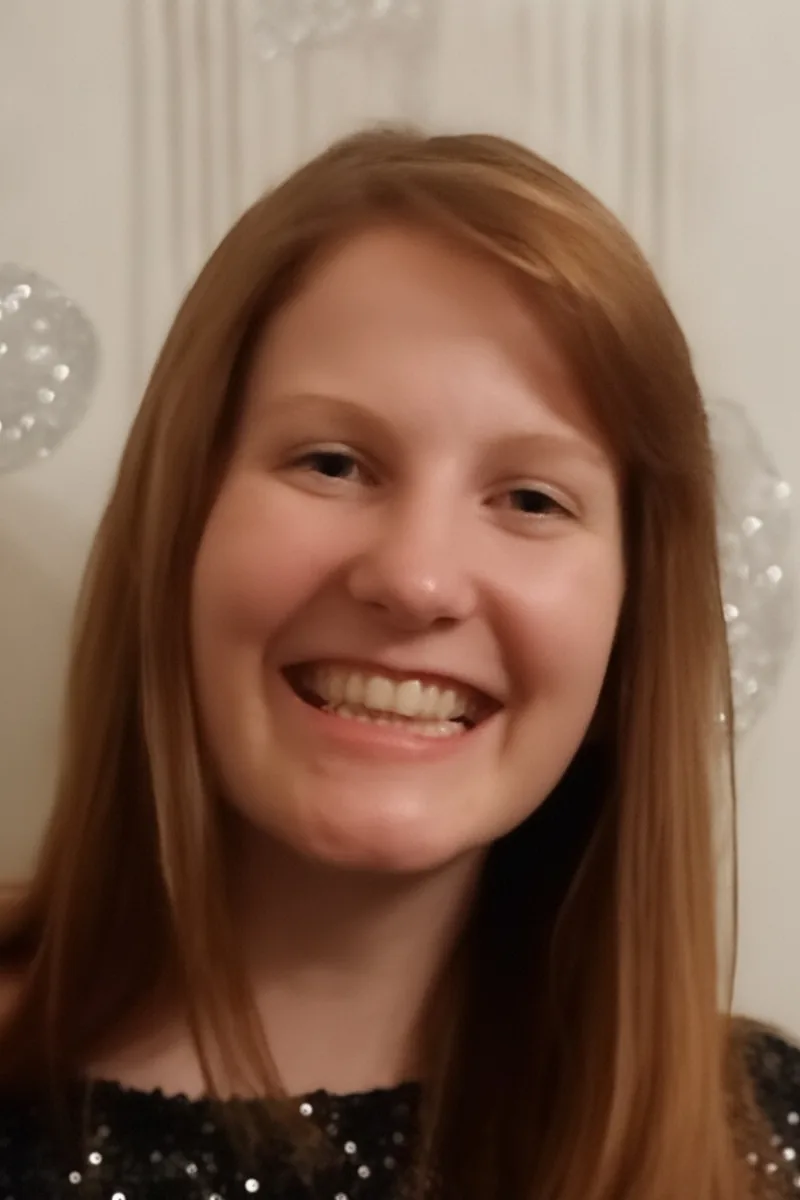
Collecting data was a daily reality in Rosemary's environmental biology program — field samples, population counts, water quality measurements — so she understands statistics as a practical tool, not just a textbook exercise. She digs into concepts like hypothesis testing, confidence intervals, and regression by walking through what each calculation actually tells you about your data. That applied perspective makes abstract ideas like p-values and standard deviation far more intuitive.
Physics majors at Colorado School of Mines don't just encounter statistics in a standalone course — they use it constantly to analyze experimental uncertainty, fit models to noisy data, and determine whether measured results are statistically significant. Jude brings that lab-bench perspective to topics like probability distributions, hypothesis testing, and regression, treating each one as a tool for answering real questions rather than an exercise in formula memorization. His 36 ACT and 4.9 rating speak to the rigor and clarity he brings to every session.
Understanding statistics requires a different kind of mathematical thinking — interpreting data, recognizing distributions, and knowing when a correlation actually means something. Marcus's dual background in biological sciences and political science gave him extensive practice with statistical analysis in two very different contexts, from lab data to polling methodology. He teaches students to read data critically rather than just calculate means and standard deviations by formula.
Ed holds a master's in Applied Statistics from Colorado State, where he conducted statistical consultations for researchers across departments. That hands-on experience means he teaches probability distributions, hypothesis testing, and regression analysis through real datasets and practical interpretation, not just formula sheets.
I am a student at the Georgia Institute of Technology studying Chemical Engineering. For the past several years, I have worked with students extensively. Through hosting events for younger kids to learn about STEM and for older teens to practice empathetic design, I know the importance of teaching students in ways that engage them rather than frustrate them, which I apply to my teaching. I have tutored high school students in a drop-in resource center in various subjects including math of all levels, chemistry, and English, making me adequately equipped in a variety of topics. I have also tutored several students long-term. Establishing relationships with students and exploring their unique learning styles is my favorite part of tutoring. I prioritize helping students discover HOW to learn in a manner that is the most effective for them, so they can begin to use those skills on their own throughout their education. Learning is a lifelong skill that requires practice for improvement; I strive to help my students gain confidence in their ability to learn.
Sarah's graduate-level research in public health and epidemiology means she uses statistics daily — hypothesis testing, confidence intervals, regression models, and probability distributions are part of her working vocabulary. She teaches these concepts through real-world data scenarios, making abstract formulas feel purposeful and concrete.
Between her sociology research in undergrad and her MBA coursework, Krupa has run enough regressions, hypothesis tests, and probability models to know exactly where students get tripped up. She tackles the conceptual side — why you'd choose a t-test over a z-test, what a p-value actually means — so the formulas stop feeling arbitrary. Her 4.9 rating speaks to how clearly she communicates these ideas.
Probability distributions, hypothesis testing, and regression analysis all click faster when you understand the engineering problems they were designed to solve. Zora's Management Science and Engineering coursework at Stanford means she teaches statistics through real applications — modeling uncertainty, interpreting p-values, and designing experiments — not just formula sheets.
Industrial engineering at Georgia Tech is essentially applied statistics — probability distributions, hypothesis testing, and regression analysis were daily tools throughout Ilesh's coursework. He teaches statistics by grounding abstract formulas in real data scenarios, so concepts like standard deviation and confidence intervals actually make intuitive sense.
A biology degree from UIUC means Todd spent years designing experiments, interpreting data sets, and running statistical tests — skills he now brings directly to tutoring statistics. He unpacks concepts like probability distributions, hypothesis testing, and standard deviation by grounding them in real data scenarios rather than abstract formulas.
A PhD statistician who also holds a biomedical engineering degree, Sam teaches introductory and intermediate statistics with an unusual amount of real-world context. Whether the topic is hypothesis testing, confidence intervals, or regression, he unpacks the logic behind each method so students can interpret results critically, not just run calculations.
Most students can plug numbers into a standard deviation formula — the harder part is interpreting what the result actually means in context. Joshitha approaches statistics by connecting every calculation to real-world reasoning: why a confidence interval narrows, what a p-value does and doesn't tell you. Her engineering background at Johns Hopkins means she uses statistical thinking constantly and can show students where these ideas live outside the textbook.
Between her biostatistics background and hands-on research experience in Northwestern's John Rogers Lab, Ingrid knows statistics as both a classroom subject and a practical tool. She walks students through concepts like hypothesis testing, confidence intervals, and probability distributions by connecting each one to what the numbers actually mean in context.
A neurobiology degree from Harvard meant designing experiments, interpreting data sets, and living inside statistical analysis for four years. Katherine teaches statistics with that research lens — connecting probability distributions, hypothesis testing, and confidence intervals to how they're actually used in published studies. Rated 5.0 by students.
A PhD in economics at Yale means Anthony doesn't just teach statistics — he relies on it daily, from econometric modeling to designing empirical studies that require careful handling of inference, sampling, and regression. His dual undergraduate background in physics and math gives him an unusual ability to trace statistical methods back to their mathematical roots, making concepts like maximum likelihood estimation or the central limit theorem genuinely intuitive. Rated 5.0 by students.
Engineering Physics at Cornell requires serious statistical reasoning — error analysis, probability distributions, hypothesis testing — so Daniel brings a practical lens to statistics rather than a purely textbook one. He walks through concepts like standard deviation, regression, and confidence intervals by tying them to real data questions, which makes the logic behind each formula click.
Probability distributions and hypothesis testing trip students up when they try to memorize formulas without understanding what a p-value actually represents or why a sample size matters. Abismael connects statistical reasoning back to real engineering applications — quality control, experimental design, process variation — which makes abstract concepts like confidence intervals tangible. He's the kind of tutor who will quiz you with problems you haven't seen before, because that's what exams do.
What separates a strong statistics student from a struggling one usually isn't computation — it's grasping why a particular test or measure fits a particular question. Tessa's mathematics coursework at Yale, paired with her history training where she regularly evaluates quantitative evidence in primary sources, gives her a sharp eye for the reasoning behind tools like confidence intervals and hypothesis tests. Rated 4.9 by students.
Testimonials
Because the right Statistics tutor makes all the difference.
Average Session Rating – Based on 3.4M Learner Ratings
Practice Statistics
Free practice tests, flashcards, and AI tutoring for Statistics
Nearby Statistics Tutors
Other Denver Tutors
Related Math Tutors in Denver
Frequently Asked Questions
Statistics is taught differently depending on whether students are using a traditional textbook, AP Statistics curriculum, or integrated math programs. Tutors work with students using their specific course materials and approach, whether that's emphasizing hypothesis testing, probability concepts, or data analysis techniques. This personalized alignment ensures tutoring reinforces what's being taught in the classroom rather than introducing conflicting methods.
Word problems in Statistics require students to translate real-world scenarios into mathematical language, identify relevant information, and choose appropriate statistical methods. Many students focus only on calculations rather than understanding what the problem is asking. Tutors help students develop a systematic approach: reading carefully, determining whether to use descriptive or inferential statistics, and working through the logic before reaching for formulas. This builds both confidence and accuracy.
Procedural understanding means knowing how to calculate standard deviation or run a t-test, while conceptual understanding means grasping why these tools work and when to use them. Many students can follow steps but struggle when faced with novel situations. Tutors help students see the bigger picture—how mean, median, and mode relate to distribution shape, or why sample size matters for confidence intervals. This deeper understanding makes Statistics click and prepares students for more advanced coursework.
Statistics anxiety often stems from feeling overwhelmed by formulas, unfamiliar terminology, or pressure to perform well on tests. Personalized tutoring creates a low-pressure environment where you can ask questions freely and work at your own pace. Tutors help you build confidence by starting with concepts you understand, showing how ideas connect logically, and celebrating progress. Breaking Statistics into manageable pieces—focusing on one technique until it's solid before moving on—removes the overwhelm and replaces it with genuine understanding.
Inferential Statistics—learning to draw conclusions about populations based on sample data—requires understanding both the logic and the mechanics. Students often memorize steps for hypothesis testing without understanding what null and alternative hypotheses represent, or why p-values matter. Tutors help by connecting inference to intuition: why larger samples give more reliable estimates, what significance levels actually mean, and how confidence intervals and hypothesis tests tell related stories. Once the conceptual framework is solid, the procedures make sense.
Strong data visualization skills are essential in modern Statistics. Many students can create a histogram or scatterplot but struggle to extract meaning from it—identifying outliers, recognizing skewness, or spotting correlation patterns. Tutors teach you how to read graphs actively: asking what story the data tells, what the shape reveals about the distribution, and what questions arise from the visualization. This skill transfers directly to interpreting real research, news articles, and professional reports.
Yes. With 9 school districts across Denver and varying approaches to Statistics education—from AP Statistics to integrated curricula to introductory college Statistics—tutors are experienced working with multiple frameworks and standards. Whether your school uses AP preparation, traditional textbooks, or project-based learning, Varsity Tutors connects you with someone familiar with your specific course and pacing, ensuring consistent support throughout the year.
Let’s find your perfect tutor
Answer a few quick questions. We’ll recommend the right plan and match you with a top 5% tutor.