Award-Winning Business Statistics Tutors
serving Dayton, OH
Business Statistics
Tutors in Dayton
Private 1-on-1 tutoring, weekly live classes for academic support, test prep & enrichment, practice tests and diagnostics, and more to elevate grades and test scores.
Based on 3.4M Learner Ratings
UniversitiesSchools & Universities
DeliveredHours Delivered
ProficiencyGrowth in Proficiency
Who needs tutoring?
No obligation. Takes ~1 minute.

Probability distributions, hypothesis testing, and regression analysis can feel abstract until someone shows you what each number actually means in a business context. Samuel draws on his applied mathematics PhD and his experience teaching both probability and college statistics to walk students through the logic behind each test, so they can interpret output confidently rather than just plugging into formulas.
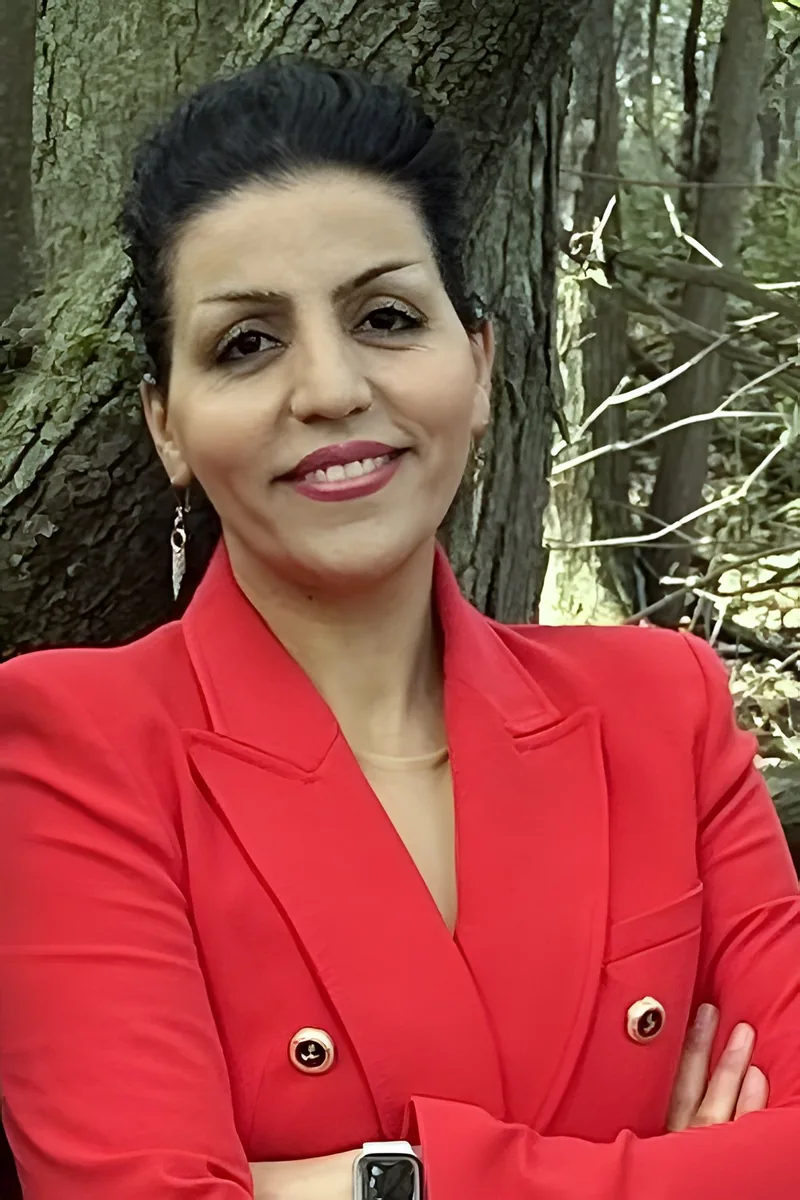
I am a graduate of the University of Waterloo, with a PhD in Geography-Water, one semester as a sessional instructor, and several semesters as a teaching assistant. I also hold a PhD in agricultural hydrology, along with five years of teaching experience as an assistant professor. These experiences have deepened my passion for teaching and my ability to communicate complex concepts effectively. I believe that while education provides knowledge, it is passion that fosters success. My mission as an educator is to make difficult subjects, such as statistics and mathematics, accessible and engaging for students. By breaking down complex ideas, I aim to create a learning environment where students feel confident and inspired. I am also enthusiastic about teaching in hydrology and environmental sciences and am committed to helping students succeed in these critical areas.
Probability distributions, hypothesis testing, regression analysis — business statistics is essentially a statistics course with corporate case studies layered on top. Irene's doctoral training and her experience teaching statistics at the graduate level mean she can explain both the theory behind a t-test and the practical interpretation a business professor expects to see in a written report.
Probability distributions, hypothesis testing, and regression analysis all click faster when someone can explain the math underneath the formulas. Nikhil studies mathematics at NYU and also tutors economics and finance, so he teaches business statistics as a toolkit for real decision-making — not just a set of calculator steps to memorize.
I am looking to tutor in the areas of: Math, English, and for test prep. I was an honors student in High School, scored very well on all my tests, and have now earned a scholarship to go to Rutgers University for the Honors Program.
Probability distributions, hypothesis testing, regression analysis — business statistics demands both mathematical precision and the ability to interpret what the numbers actually mean for a decision. Andy's finance program at Boston College requires heavy statistical coursework, so he approaches these topics with a practical lens: not just computing a p-value, but understanding what it tells a manager.
Probability distributions, hypothesis testing, and regression analysis form the backbone of business statistics, and each one requires a different way of thinking about data. Kunal approaches these topics through a finance lens, showing students how statistical tools apply to real decisions like portfolio risk assessment and demand forecasting. His comfort with numbers makes even z-tables and confidence intervals feel approachable.
Regression analysis, hypothesis testing, and probability distributions make a lot more sense when you can tie them to real business decisions — pricing models, quality control, market forecasting. Olga's dual background in economics and statistics means she teaches these tools the way they're actually used, not just as abstract formulas on a homework set. Rated 4.6 by students.
Christopher's finance and business analytics coursework at Indiana University means he's actively working through the same statistical methods — sampling distributions, hypothesis testing, regression — that show up in business statistics classes, and he pairs that with hands-on Microsoft Excel tutoring on campus. That combination lets him teach not just the conceptual side but also how to actually build and interpret statistical output in a spreadsheet, which is where most business statistics assignments live.
Master's grad with 10+ YOE teaching Artificial Intelligence, Agentic Programming, Math, Economics, Econometrics, Statistics and Data Science programming from middle school to University. I'm an economist with multiple areas of expertise, and experience helping students achieve their goals in academic and professional life. My sessions are structured, goal-oriented, and designed to help students improve quickly, whether they are preparing for exams, struggling with weekly problem sets, or working on data-based assignments.
Probability distributions, hypothesis testing, and regression analysis all click faster when someone can connect them to real decisions — like whether a marketing campaign actually moved the needle or just got lucky. Andrea's engineering coursework at Drexel is heavy on applied statistics, so she walks through concepts like p-values and confidence intervals with practical examples rather than abstract proofs.
Regression output, hypothesis testing, confidence intervals — business statistics asks students to interpret quantitative results and make decisions under uncertainty. Daniel approaches each concept by connecting it to a concrete business question, like whether a marketing campaign actually moved sales or whether the result was just noise. His accounting and analytics background keeps the instruction grounded in practical application rather than abstract formulas.
I am a firm believer of this and, as such, I do not spoon feed students during sessions but rather guide them to figure out how to answer their own questions and solve their own problems. Thus, I focus not only on what to do, but how and why to do it. One of the most significant drivers of independent learning is curiosity, and this is one of the primary traits I aim to cultivate in students.
Testimonials
Because the right Business Statistics tutor makes all the difference.
Average Session Rating – Based on 3.4M Learner Ratings
Other Dayton Tutors
Related Business Tutors in Dayton
Frequently Asked Questions
Business Statistics typically covers descriptive statistics (mean, median, standard deviation), probability distributions, hypothesis testing, regression analysis, and data visualization. Students learn to analyze real-world business data, make predictions, and support decision-making with statistical evidence. The course emphasizes practical application over pure theory, so you'll work with datasets and business scenarios throughout.
Many students struggle with interpreting statistical concepts conceptually rather than just memorizing formulas—understanding *why* we use a t-test versus an ANOVA, for example. Word problems that require translating business scenarios into statistical questions are another common pain point. Additionally, students often find it difficult to decide which statistical method applies to a given problem and to communicate their findings clearly.
During an initial session, a tutor will assess your current understanding of statistics fundamentals, identify specific topics causing difficulty, and learn about your course requirements and goals. You'll discuss whether you need help with conceptual understanding, problem-solving strategies, exam preparation, or all three. This helps the tutor create a personalized plan tailored to your needs.
Tutors help you develop a structured approach to statistical problems: clearly defining your hypothesis, selecting the appropriate test, showing each calculation step, and interpreting results in context. This systematic method not only earns full credit on assignments and exams but also deepens your understanding of *why* each step matters. You'll learn to recognize problem patterns and apply the right strategy confidently.
Business Statistics is designed for practical decision-making—analyzing sales trends, evaluating marketing campaigns, assessing quality control, or forecasting revenue. Tutors help you see how statistical concepts apply to actual business scenarios, making abstract ideas concrete. This approach not only improves your grades but also builds skills you'll use in internships, business courses, and your career.
Varsity Tutors connects you with expert tutors in the Dayton area who specialize in Business Statistics and understand local curriculum standards across our 67 schools and 29 school districts. You can share your specific challenges—whether it's regression analysis, hypothesis testing, or exam prep—and get matched with a tutor whose teaching style fits your learning needs. The process is straightforward and personalized to your goals.
Absolutely. Many students feel anxious about statistics because it combines math with unfamiliar concepts, but personalized tutoring breaks this down into manageable pieces. A tutor works at your pace, explains concepts multiple ways, and builds your confidence through practice and success. Over time, you'll see patterns, understand the logic behind methods, and develop the confidence to tackle problems independently.
Yes, different textbooks and courses emphasize different approaches—some focus heavily on Excel or R programming, while others emphasize conceptual understanding and hand calculations. When you connect with a tutor, let them know which textbook and course format you're using. Experienced tutors are familiar with various curricula and can tailor explanations and practice problems to match exactly what your course requires.
Let’s find your perfect tutor
Answer a few quick questions. We’ll recommend the right plan and match you with a top 5% tutor.