Create an account to track your scores
and create your own practice tests:
Test: SAT II Math II
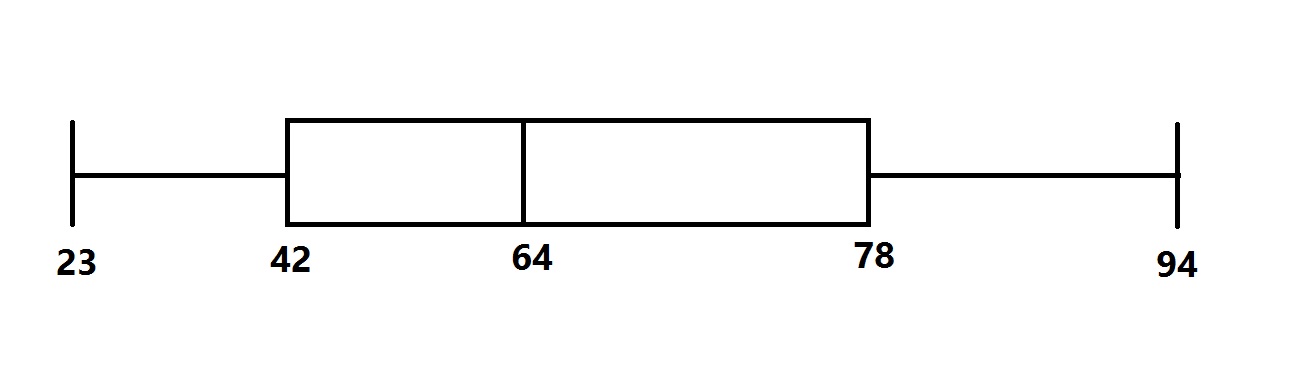
| 1. | The distribution of scores for a test given to a large group of students is represented by the above box-and-whisker plot. To the nearest whole number, what was the standard deviation of the scores? |

Insufficient information is given to answer the question.


Popular Subjects
ACT Tutors in Boston, French Tutors in Dallas Fort Worth, Statistics Tutors in Washington DC, Math Tutors in Washington DC, SSAT Tutors in Atlanta, GRE Tutors in Chicago, Reading Tutors in Denver, Algebra Tutors in Boston, SAT Tutors in Philadelphia, ACT Tutors in San Francisco-Bay Area
Popular Courses & Classes
LSAT Courses & Classes in Atlanta, GRE Courses & Classes in Houston, MCAT Courses & Classes in New York City, SAT Courses & Classes in Dallas Fort Worth, GMAT Courses & Classes in Seattle, SAT Courses & Classes in Washington DC, SSAT Courses & Classes in Seattle, ISEE Courses & Classes in Denver, ISEE Courses & Classes in New York City, GMAT Courses & Classes in Atlanta
Popular Test Prep
SSAT Test Prep in Dallas Fort Worth, GRE Test Prep in Washington DC, GMAT Test Prep in Phoenix, GMAT Test Prep in San Francisco-Bay Area, MCAT Test Prep in Los Angeles, ISEE Test Prep in Los Angeles, GRE Test Prep in Houston, ISEE Test Prep in New York City, GRE Test Prep in Los Angeles, SAT Test Prep in Los Angeles

