Award-Winning Business Statistics Tutors
serving Syracuse, NY
Business Statistics
Tutors in Syracuse
Private 1-on-1 tutoring, weekly live classes for academic support, test prep & enrichment, practice tests and diagnostics, and more to elevate grades and test scores.
Based on 3.4M Learner Ratings
UniversitiesSchools & Universities
DeliveredHours Delivered
ProficiencyGrowth in Proficiency
Who needs tutoring?
No obligation. Takes ~1 minute.
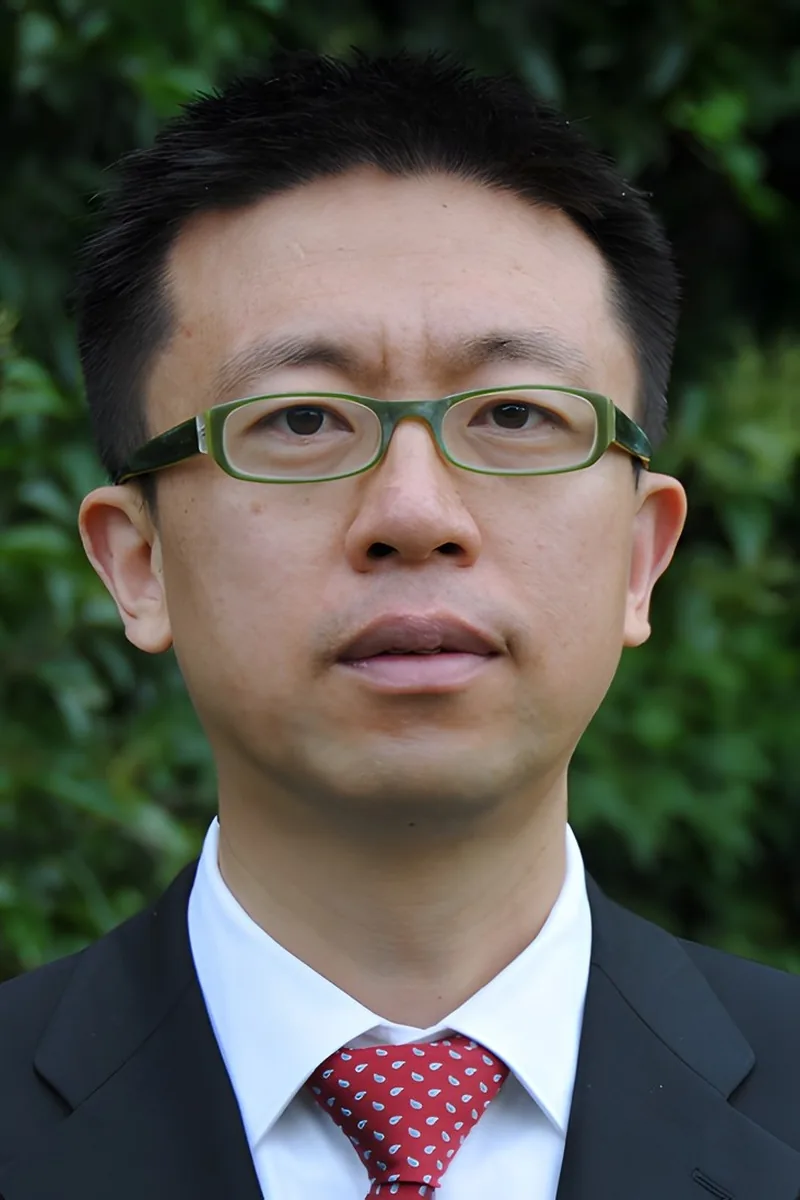
I am highly praised by my students and supervisors. Even today I still kept the communication with many students.

Probability distributions, hypothesis testing, and regression analysis become far less intimidating when taught by someone who uses data to advise real businesses. Jing's cross-border consulting work means she regularly interprets quantitative trends to guide strategy, and her 99th-percentile GMAT quantitative score speaks to the analytical rigor she brings to every session. Rated 5.0 by students.
I am a firm believer of this and, as such, I do not spoon feed students during sessions but rather guide them to figure out how to answer their own questions and solve their own problems. Thus, I focus not only on what to do, but how and why to do it. One of the most significant drivers of independent learning is curiosity, and this is one of the primary traits I aim to cultivate in students.
Probability distributions, hypothesis testing, and regression analysis all click faster when someone can explain the math underneath the formulas. Nikhil studies mathematics at NYU and also tutors economics and finance, so he teaches business statistics as a toolkit for real decision-making — not just a set of calculator steps to memorize.
The trickiest part of business statistics for most students isn't the formulas — it's knowing when to use a t-test versus a chi-square, or interpreting a regression output in plain English. Kayla's psychology training at Penn State required heavy coursework in statistical methods and research design, so she explains concepts like p-values, confidence intervals, and hypothesis testing from genuine experience with data analysis.
Regression analysis, hypothesis testing, and probability distributions make a lot more sense when you can tie them to real business decisions — pricing models, quality control, market forecasting. Olga's dual background in economics and statistics means she teaches these tools the way they're actually used, not just as abstract formulas on a homework set. Rated 4.6 by students.
Confidence intervals, hypothesis testing, and regression analysis show up constantly in business programs, and the notation alone can be intimidating. Vicquaja combines her statistics coursework with real economic context, teaching students to interpret p-values and build models that actually answer a business question rather than just satisfy a formula sheet.
Master's grad with 10+ YOE teaching Artificial Intelligence, Agentic Programming, Math, Economics, Econometrics, Statistics and Data Science programming from middle school to University. I'm an economist with multiple areas of expertise, and experience helping students achieve their goals in academic and professional life. My sessions are structured, goal-oriented, and designed to help students improve quickly, whether they are preparing for exams, struggling with weekly problem sets, or working on data-based assignments.
Probability distributions, hypothesis testing, and regression analysis look different when the dataset comes from a market report instead of a textbook exercise. Adeyemi's master's-level training in biostatistics translates directly to business statistics — the core methods are identical, and he's skilled at walking through problems using real-world data contexts that make concepts like p-values and confidence intervals click.
Probability distributions, hypothesis testing, and regression analysis all click faster when someone can connect them to real decisions — like whether a marketing campaign actually moved the needle or just got lucky. Andrea's engineering coursework at Drexel is heavy on applied statistics, so she walks through concepts like p-values and confidence intervals with practical examples rather than abstract proofs.
Probability distributions, hypothesis testing, and regression analysis all clicked for Matthew during his master's research, where he used statistical methods to identify patterns in paleobiological data sets. He unpacks business statistics problems by connecting each formula to what it actually measures, so students can interpret output rather than just calculate it.
An economics degree means Shua spent semesters buried in statistical methods — sampling distributions, regression modeling, variance analysis — applied to real economic questions like labor market trends and consumer behavior. That background translates directly to business statistics, where the same toolkit gets aimed at operational and strategic decisions. He breaks down the reasoning behind each test so students can interpret results, not just calculate them.
I am a graduate of the University of Waterloo, with a PhD in Geography-Water, one semester as a sessional instructor, and several semesters as a teaching assistant. I also hold a PhD in agricultural hydrology, along with five years of teaching experience as an assistant professor. These experiences have deepened my passion for teaching and my ability to communicate complex concepts effectively. I believe that while education provides knowledge, it is passion that fosters success. My mission as an educator is to make difficult subjects, such as statistics and mathematics, accessible and engaging for students. By breaking down complex ideas, I aim to create a learning environment where students feel confident and inspired. I am also enthusiastic about teaching in hydrology and environmental sciences and am committed to helping students succeed in these critical areas.
Probability distributions, hypothesis testing, and regression analysis tend to feel abstract until they're tied to a concrete business question. Andrew approaches business statistics as a decision-making tool — teaching students to interpret p-values and confidence intervals in the context of real market scenarios. His engineering training built the quantitative rigor, and his MBA sharpened the business intuition.
I hold a Bachelor of Mathematics in Statistics from the University of Waterloo (with distinction). I have 6 years of experience as a (Senior) Data Scientist, where I visualized, presented and communicated highly complex mathematical and statistical concepts and systems to audiences with varying levels of technical knowledge, making them simple, clear, and engaging. With 2+ years of teaching experience, I've become exceptional at the following: 1. Visualize the abstract. Make the invisible visible. I'm a visual teacher who creates carefully designed diagrams and presentations to guide you through mathematical concepts step by step. 2. Simplify the complex. Make mathematical jargon intuitive. I use creative, intuitive explanations, helpful memory aids, and efficient techniques to make mathematical concepts easier to grasp and apply. 3. Catch the gaps early. Strengthen your foundations. I identify gaps in your mathematical understanding early on and address them with targeted practices.
Regression analysis, hypothesis testing, confidence intervals — business statistics is where many students first confront serious applied math. Muhammad's engineering coursework means he uses these statistical tools daily, so he can explain not just how to run a t-test but why a particular test applies to a given business scenario. He builds intuition around probability distributions so students stop second-guessing which formula to reach for.
Teaching statistics across multiple universities — including courses in public health and social sciences — gave David a deep toolbox for making business statistics accessible. He tackles probability distributions, hypothesis testing, and regression analysis by anchoring each technique in practical research questions, so students understand not just how to run a test but when and why to choose it. Rated 5.0 by students.
Regression output, hypothesis testing, confidence intervals — business statistics asks students to interpret quantitative results and make decisions under uncertainty. Daniel approaches each concept by connecting it to a concrete business question, like whether a marketing campaign actually moved sales or whether the result was just noise. His accounting and analytics background keeps the instruction grounded in practical application rather than abstract formulas.
Probability distributions, hypothesis testing, regression analysis — business statistics is where raw data becomes actionable insight, and it trips up students who breezed through earlier math courses. David tackles these concepts through an economist's lens, tying each statistical method back to the kind of business question it actually answers. Rated 4.8 by students, he's comfortable with both the formulas and the interpretation side.
Testimonials
Because the right Business Statistics tutor makes all the difference.
Average Session Rating – Based on 3.4M Learner Ratings
Nearby Business Statistics Tutors
Other Syracuse Tutors
Related Business Tutors in Syracuse
Frequently Asked Questions
Varsity Tutors matches Syracuse students with expert Business Statistics tutors for 1-on-1 instruction. We pair each student with a tutor based on their specific needs, learning style, and goals.
Whether you need homework help, exam prep, or want to get ahead, our Business Statistics tutors are ready to help.
Common challenges include gaps from earlier material, difficulty with specific concepts, and trouble applying learning to new problems. These issues can snowball quickly in Business Statistics.
A tutor identifies where you're stuck, fills in gaps, and provides targeted practice. The 1-on-1 format means you get help exactly where you need it.
Tutors work with your student's actual coursework—homework assignments, class notes, and upcoming tests. This keeps tutoring directly relevant to what's happening in the classroom.
When you share information about your student's school and curriculum, we can match you with a tutor who has relevant experience.
All tutors complete background checks, credential verification, and teaching evaluation. Many of our Business Statistics tutors hold advanced degrees or have years of teaching experience.
You can review tutor profiles to find someone with the right background for your student's level and needs.
Many students see improved grades within a few weeks, along with better understanding of Business Statistics concepts and more confidence tackling challenging material.
Tutors track progress and adjust their approach to ensure continued improvement.
Most students benefit from 1-2 sessions per week. More frequent sessions help if your student is significantly behind or has an important exam coming up.
Your tutor can recommend a schedule based on your student's specific situation and goals.
Tutoring is purchased in packages of hours, with rates varying by tutor experience. Varsity Tutors offers several options to fit different budgets and needs.
You can discuss pricing during your consultation to find what works best.
Your tutor will assess where your student is, discuss goals, and start working on priority areas. Most students bring current homework or upcoming test material to focus on.
By the end, you'll have a clear sense of how the tutor can help and a plan for moving forward.
Let’s find your perfect tutor
Answer a few quick questions. We’ll recommend the right plan and match you with a top 5% tutor.