Create an account to track your scores
and create your own practice tests:
Test: Common Core: 6th Grade Math
| 1. | Select the description that best describes the distribution of the data shown in the provided dot plot.
|
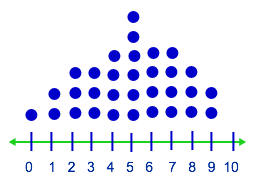
Right skewed
Symmetric
Left skewed


Popular Subjects
GRE Tutors in Phoenix, Computer Science Tutors in Chicago, ACT Tutors in Seattle, Statistics Tutors in San Diego, Statistics Tutors in Denver, SSAT Tutors in San Francisco-Bay Area, Calculus Tutors in Miami, ACT Tutors in Phoenix, ACT Tutors in Washington DC, Computer Science Tutors in Houston
Popular Courses & Classes
MCAT Courses & Classes in Philadelphia, GRE Courses & Classes in Phoenix, SAT Courses & Classes in Miami, GMAT Courses & Classes in Philadelphia, ACT Courses & Classes in Philadelphia, MCAT Courses & Classes in San Francisco-Bay Area, MCAT Courses & Classes in Dallas Fort Worth, SSAT Courses & Classes in Atlanta, ACT Courses & Classes in Phoenix, MCAT Courses & Classes in Miami
Popular Test Prep
ISEE Test Prep in San Diego, MCAT Test Prep in San Francisco-Bay Area, LSAT Test Prep in Denver, ISEE Test Prep in Miami, SSAT Test Prep in Los Angeles, LSAT Test Prep in San Francisco-Bay Area, SSAT Test Prep in Phoenix, LSAT Test Prep in Atlanta, SSAT Test Prep in Dallas Fort Worth, GRE Test Prep in Washington DC

