Create an account to track your scores
and create your own practice tests:
Test: SAT Mathematics
| 1. | The below tables show the way that a certain high school converts letter grades to numerical grades, and the math grades of a particular high school’s 65-person graduating class.
Which of the following best describes the data outlined in the tables? |
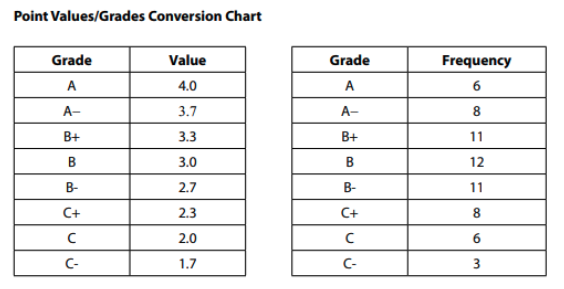
If three new students were added to the class and each scored an A, the new class average would be greater than or equal to 3.0.
The median math grade of the 65 students is higher than the mean math grade of the 65 students.
The median math grade of the 65 students is less than a 3.0.
The mean math grade of the 65 students was 3.0.

Guendolyn
Certified Tutor
Certified Tutor
Cebu Normal University, Bachelor of Education, Elementary School Teaching.

Anuradha
Certified Tutor
Certified Tutor
University of Maryland-College Park, Bachelor in Arts, Education of Individuals in Secondary Special Education Programs.

Popular Subjects
ACT Tutors in San Francisco-Bay Area, Spanish Tutors in Dallas Fort Worth, SAT Tutors in Miami, Physics Tutors in San Diego, GMAT Tutors in Atlanta, Computer Science Tutors in San Diego, Physics Tutors in Miami, ACT Tutors in Denver, LSAT Tutors in Boston, Computer Science Tutors in Dallas Fort Worth
Popular Courses & Classes
GMAT Courses & Classes in Philadelphia, LSAT Courses & Classes in Los Angeles, SSAT Courses & Classes in Washington DC, GMAT Courses & Classes in Washington DC, ISEE Courses & Classes in Houston, MCAT Courses & Classes in Boston, MCAT Courses & Classes in Philadelphia, MCAT Courses & Classes in Seattle, MCAT Courses & Classes in Atlanta, GMAT Courses & Classes in Los Angeles

