Create an account to track your scores
and create your own practice tests:
Test: SAT II Math II
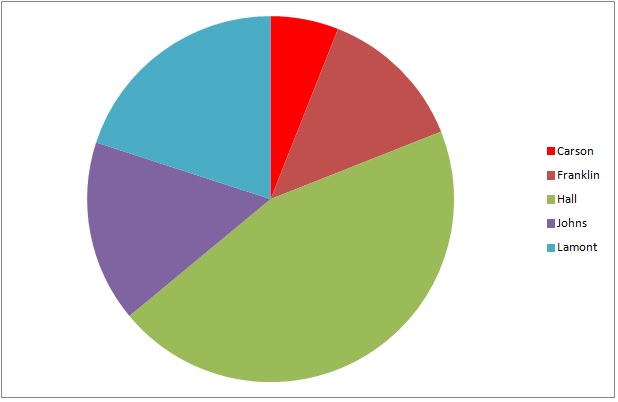
| 1. | The above graph represents the results of a general election for mayor of Kingston. If 8,349 people voted, which of the following numbers is closest to the number of voters who did not vote for the winning candidate? |


Popular Subjects
English Tutors in San Francisco-Bay Area, English Tutors in Chicago, Spanish Tutors in San Diego, Biology Tutors in Boston, GMAT Tutors in Houston, GRE Tutors in Miami, GMAT Tutors in Chicago, French Tutors in Miami, English Tutors in San Diego, Math Tutors in Denver
Popular Courses & Classes
ACT Courses & Classes in Atlanta, ISEE Courses & Classes in Miami, SAT Courses & Classes in Los Angeles, SAT Courses & Classes in Seattle, GRE Courses & Classes in Seattle, SSAT Courses & Classes in Boston, ISEE Courses & Classes in Denver, GMAT Courses & Classes in Chicago, LSAT Courses & Classes in Dallas Fort Worth, MCAT Courses & Classes in Boston
Popular Test Prep
GMAT Test Prep in San Diego, SAT Test Prep in Houston, MCAT Test Prep in Seattle, SSAT Test Prep in Dallas Fort Worth, LSAT Test Prep in Washington DC, ACT Test Prep in Washington DC, GMAT Test Prep in Chicago, SSAT Test Prep in Los Angeles, GMAT Test Prep in Los Angeles, LSAT Test Prep in Los Angeles

