Create an account to track your scores
and create your own practice tests:
Test: GED Math
The following graph charts the number of attendees at a theme park over the course of a year.
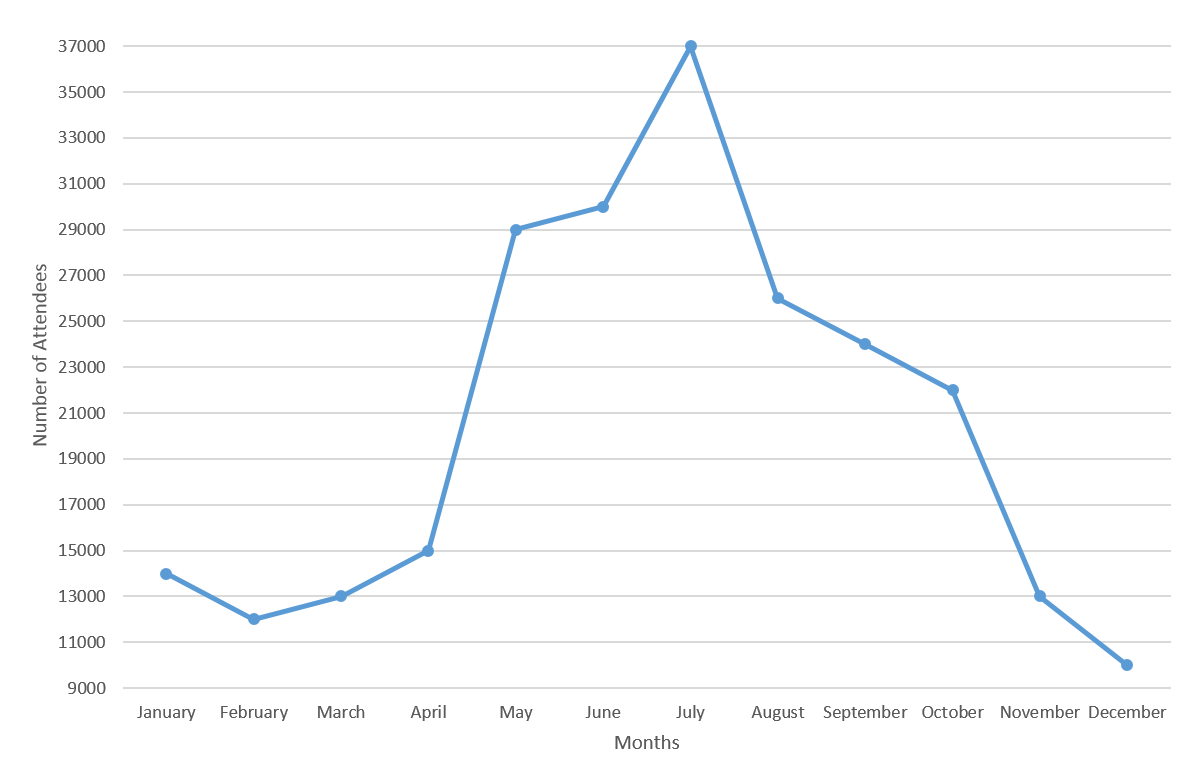
| 1. | By what percentage did attendance at the park increase from April to May? |


Popular Subjects
Reading Tutors in Los Angeles, Physics Tutors in Washington DC, Chemistry Tutors in Washington DC, MCAT Tutors in Seattle, LSAT Tutors in San Diego, Statistics Tutors in Houston, Math Tutors in Boston, Algebra Tutors in Boston, MCAT Tutors in Washington DC, GRE Tutors in Atlanta
Popular Courses & Classes
ACT Courses & Classes in Atlanta, GMAT Courses & Classes in Dallas Fort Worth, ACT Courses & Classes in Denver, MCAT Courses & Classes in Denver, SAT Courses & Classes in Los Angeles, ACT Courses & Classes in Dallas Fort Worth, GMAT Courses & Classes in Los Angeles, LSAT Courses & Classes in Chicago, GMAT Courses & Classes in Denver, GRE Courses & Classes in Houston
Popular Test Prep
ISEE Test Prep in Seattle, ACT Test Prep in Dallas Fort Worth, GRE Test Prep in San Diego, GMAT Test Prep in Denver, GRE Test Prep in Washington DC, LSAT Test Prep in Seattle, ISEE Test Prep in Los Angeles, ACT Test Prep in Denver, SSAT Test Prep in Phoenix, GMAT Test Prep in Dallas Fort Worth

