Create an account to track your scores
and create your own practice tests:
Test: Statistics
| 1. | A social scientist performs an experiment testing the frequency and correlation of several demographics. She plots a histogram measuring income versus education level. She produces the following graph: Which of the following choices best describes this model? |
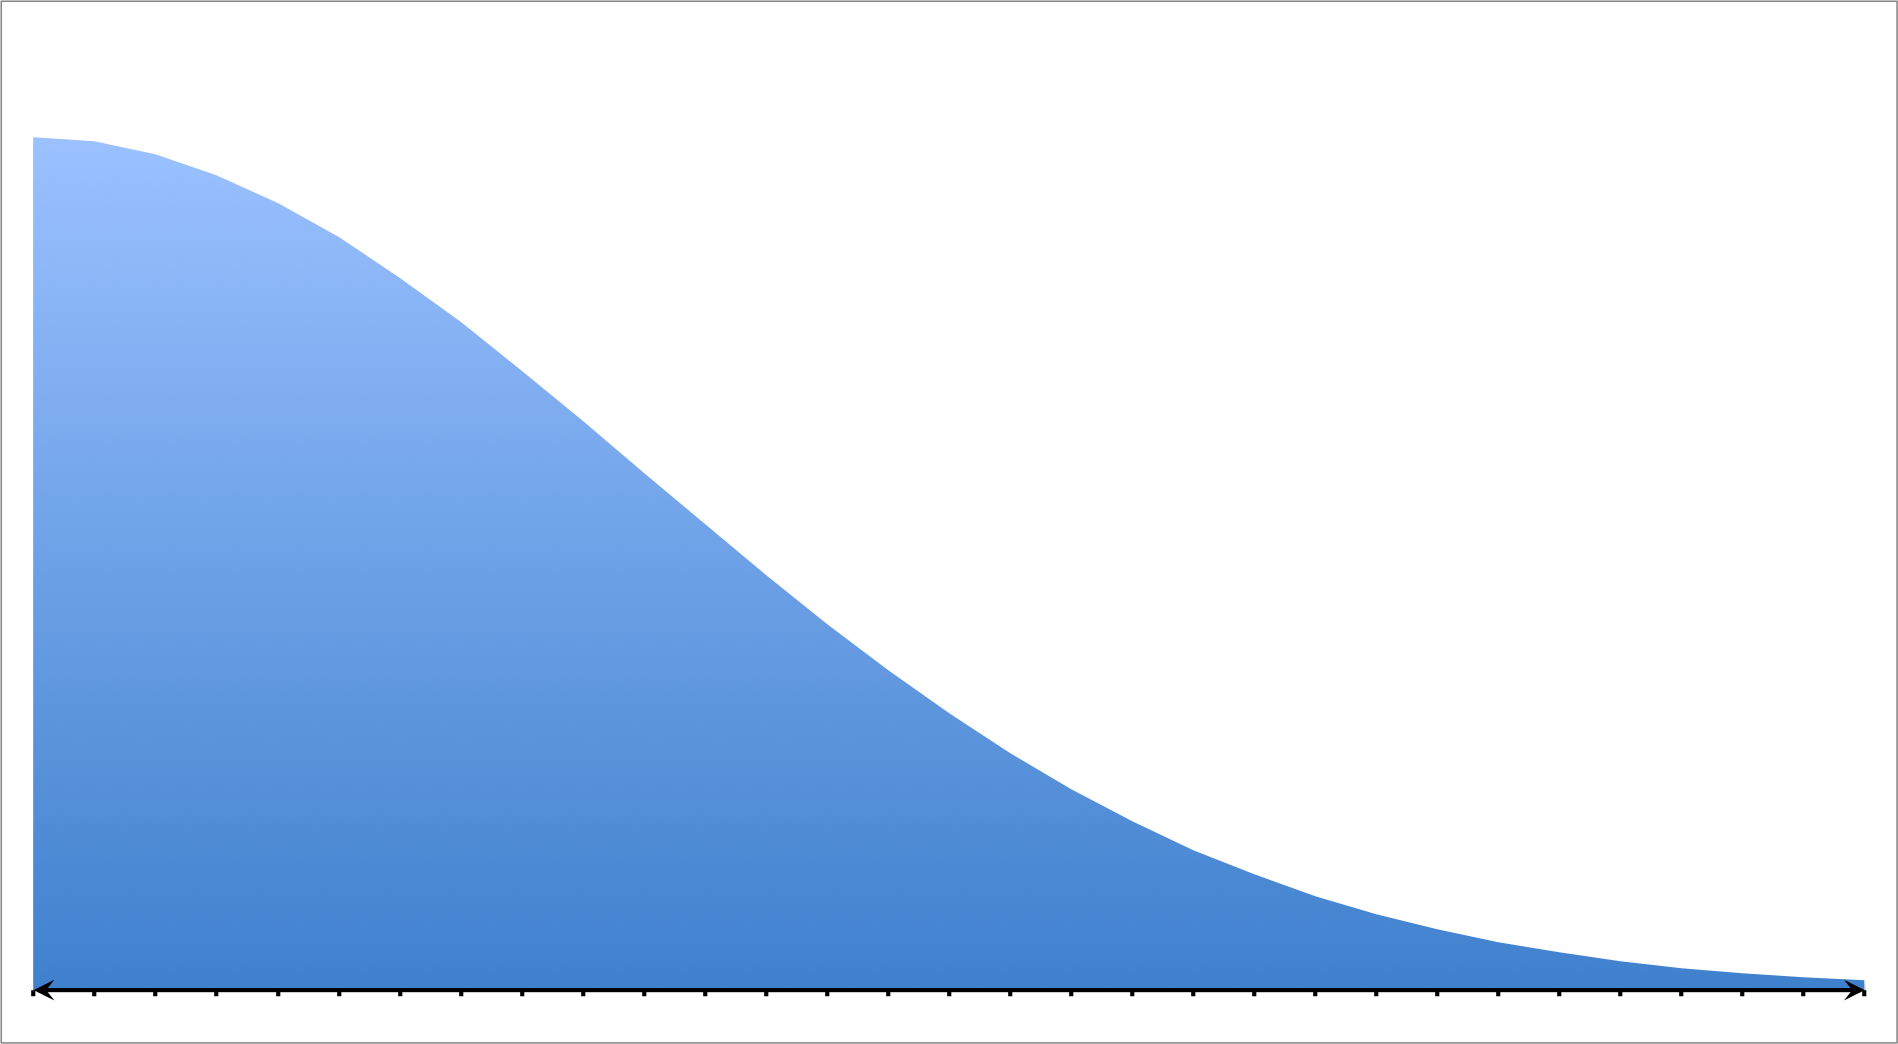
Uniform
Right Skewed
None of these
Bimodal
Left Skewed


Popular Subjects
SAT Tutors in Dallas Fort Worth, Physics Tutors in Houston, Computer Science Tutors in Houston, Reading Tutors in Philadelphia, LSAT Tutors in Phoenix, Math Tutors in Los Angeles, Math Tutors in San Diego, Reading Tutors in Boston, ISEE Tutors in Philadelphia, SAT Tutors in Phoenix
Popular Courses & Classes
Spanish Courses & Classes in Seattle, SAT Courses & Classes in Washington DC, MCAT Courses & Classes in Boston, MCAT Courses & Classes in Dallas Fort Worth, Spanish Courses & Classes in Miami, ACT Courses & Classes in Dallas Fort Worth, ACT Courses & Classes in Chicago, LSAT Courses & Classes in New York City, GRE Courses & Classes in Chicago, LSAT Courses & Classes in Washington DC
Popular Test Prep
ACT Test Prep in Boston, SAT Test Prep in Philadelphia, GRE Test Prep in Boston, GMAT Test Prep in Houston, MCAT Test Prep in New York City, ISEE Test Prep in Washington DC, GRE Test Prep in Philadelphia, LSAT Test Prep in Seattle, MCAT Test Prep in Dallas Fort Worth, SAT Test Prep in San Francisco-Bay Area

