Create an account to track your scores
and create your own practice tests:
Test: SSAT Middle Level Math

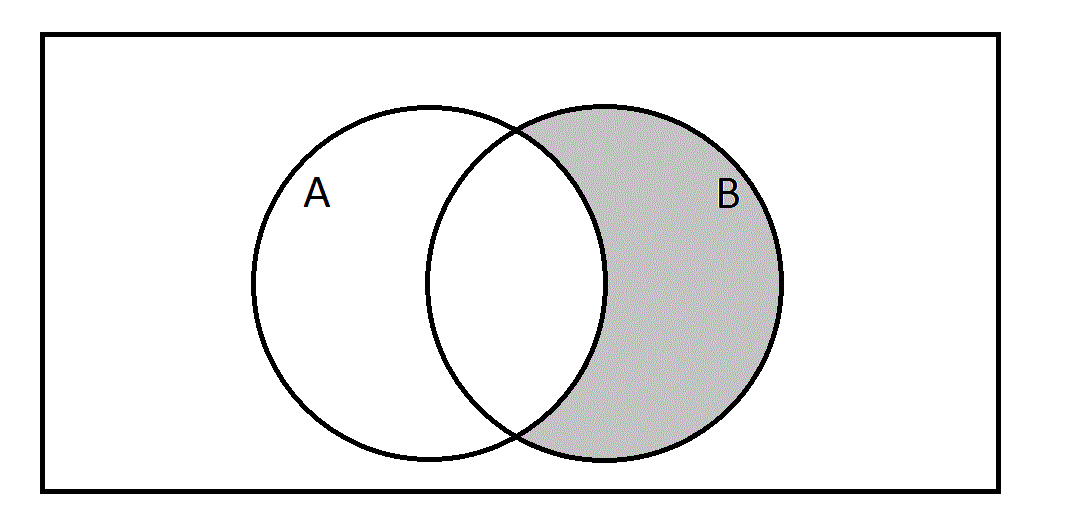
| 1. | See the above Venn diagram. Which of the following sets is represented by the gray region? |
Benjamin
Certified Tutor
Certified Tutor
Cleveland State University, Bachelors, History. Cleveland State University, Masters, Curriculum and Instruction.
Popular Subjects
Chemistry Tutors in San Diego, Computer Science Tutors in Atlanta, MCAT Tutors in Seattle, GRE Tutors in Philadelphia, GMAT Tutors in San Diego, LSAT Tutors in Houston, GRE Tutors in Boston, Chemistry Tutors in Atlanta, French Tutors in Phoenix, ACT Tutors in Seattle
Popular Courses & Classes
GMAT Courses & Classes in Miami, SSAT Courses & Classes in Dallas Fort Worth, GMAT Courses & Classes in Denver, LSAT Courses & Classes in Dallas Fort Worth, SAT Courses & Classes in Los Angeles, GRE Courses & Classes in Los Angeles, GRE Courses & Classes in Denver, GMAT Courses & Classes in Los Angeles, GRE Courses & Classes in Boston, MCAT Courses & Classes in Atlanta
Popular Test Prep
MCAT Test Prep in Boston, GRE Test Prep in Los Angeles, LSAT Test Prep in Washington DC, SSAT Test Prep in Phoenix, SSAT Test Prep in Dallas Fort Worth, GRE Test Prep in Atlanta, SAT Test Prep in Dallas Fort Worth, ISEE Test Prep in Phoenix, ISEE Test Prep in Seattle, MCAT Test Prep in Phoenix


