Create an account to track your scores
and create your own practice tests:
Test: GED Math
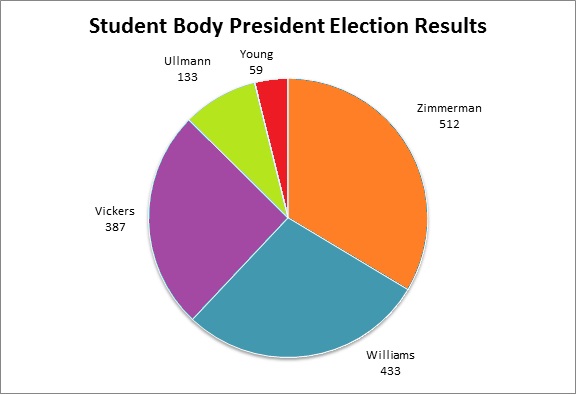
| 1. | The above circle graph shows the results of a student body election. By the rules, if no candidate wins more than 50% of the vote, there will be a runoff between the top two finishers. Which of the following questions cannot be answered about the election by examining the above graph? |
What percent of the vote did Ullman win?
How many students did not vote?
Who will face each other in the runoff?
How many more votes did Williams get than Vickers?

Jared
Certified Tutor
Certified Tutor
Ohio State University-Main Campus, Bachelor of Science, Zoology. Tulane University of Louisiana, Current Grad Student, Public...

Hangping
Certified Tutor
Certified Tutor
Georgia Institute of Technology, Master's/Graduate, Environmental Engineering .

Popular Subjects
MCAT Tutors in Boston, Math Tutors in Atlanta, MCAT Tutors in New York City, ACT Tutors in Chicago, Spanish Tutors in Philadelphia, Spanish Tutors in Atlanta, Spanish Tutors in Los Angeles, LSAT Tutors in San Diego, Math Tutors in Denver, Spanish Tutors in Boston
Popular Courses & Classes
GRE Courses & Classes in San Francisco-Bay Area, Spanish Courses & Classes in Atlanta, ACT Courses & Classes in San Francisco-Bay Area, SSAT Courses & Classes in Boston, MCAT Courses & Classes in Miami, MCAT Courses & Classes in Los Angeles, ACT Courses & Classes in New York City, LSAT Courses & Classes in San Francisco-Bay Area, Spanish Courses & Classes in Dallas Fort Worth, ACT Courses & Classes in Los Angeles

