Create an account to track your scores
and create your own practice tests:
Test: ACT Science
The graph below depicts the position of three different cars over a 15-second time interval.
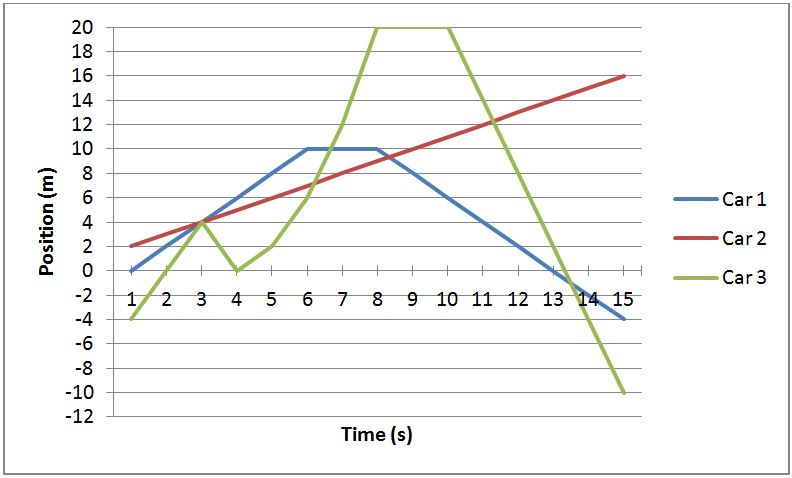
| 9. | If Car 3 continues to travel at it's current speed at t = 15 seconds, what will it's position be at time = 20s? |
30 m
–30 m
–26 m
–34 m
26 m


ACT Science Tutors in Top Cities:
Atlanta ACT Science Tutors, Austin ACT Science Tutors, Boston ACT Science Tutors, Chicago ACT Science Tutors, Dallas Fort Worth ACT Science Tutors, Denver ACT Science Tutors, Houston ACT Science Tutors, Kansas City ACT Science Tutors, Los Angeles ACT Science Tutors, Miami ACT Science Tutors, New York City ACT Science Tutors, Philadelphia ACT Science Tutors, Phoenix ACT Science Tutors, San Diego ACT Science Tutors, San Francisco-Bay Area ACT Science Tutors, Seattle ACT Science Tutors, St. Louis ACT Science Tutors, Tucson ACT Science Tutors, Washington DC ACT Science Tutors
Popular Courses & Classes
ISEE Courses & Classes in Seattle, ACT Courses & Classes in Atlanta, GRE Courses & Classes in Denver, ACT Courses & Classes in New York City, SSAT Courses & Classes in Philadelphia, SAT Courses & Classes in Denver, ISEE Courses & Classes in Chicago, LSAT Courses & Classes in Phoenix, ACT Courses & Classes in Chicago, GRE Courses & Classes in New York City
Popular Test Prep
GMAT Test Prep in Seattle, SSAT Test Prep in Boston, GRE Test Prep in Chicago, SSAT Test Prep in New York City, ISEE Test Prep in Denver, LSAT Test Prep in Chicago, GRE Test Prep in New York City, SSAT Test Prep in Chicago, LSAT Test Prep in Los Angeles, ACT Test Prep in Washington DC

