Create an account to track your scores
and create your own practice tests:
Test: SAT Math
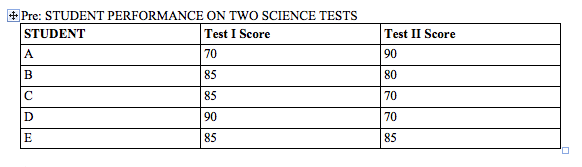
| 1. | The chart above shows the scores on two tests for five students in a science class. If John's score was equal to the mode for Test I and equal to the median for Test II, then which of the five students represents John's scores? |
D
B
C
E
A

Edmund
Certified Tutor
Certified Tutor
Boston University, Bachelors, Music. Boston University, Masters, Business Administration (Public and Non-profit).

Joseph
Certified Tutor
Certified Tutor
University of Houston, Bachelors, Mechanical Engineering. University of California-Berkeley, PHD, Nuclear Engineering.

SAT Math Tutors in Top Cities:
Atlanta SAT Math Tutors, Austin SAT Math Tutors, Boston SAT Math Tutors, Chicago SAT Math Tutors, Dallas Fort Worth SAT Math Tutors, Denver SAT Math Tutors, Houston SAT Math Tutors, Kansas City SAT Math Tutors, Los Angeles SAT Math Tutors, Miami SAT Math Tutors, New York City SAT Math Tutors, Philadelphia SAT Math Tutors, Phoenix SAT Math Tutors, San Diego SAT Math Tutors, San Francisco-Bay Area SAT Math Tutors, Seattle SAT Math Tutors, St. Louis SAT Math Tutors, Tucson SAT Math Tutors, Washington DC SAT Math Tutors
Popular Courses & Classes
ISEE Courses & Classes in Chicago, LSAT Courses & Classes in Atlanta, GMAT Courses & Classes in Boston, GRE Courses & Classes in Boston, GRE Courses & Classes in Chicago, SSAT Courses & Classes in Dallas Fort Worth, MCAT Courses & Classes in Washington DC, Spanish Courses & Classes in Washington DC, SAT Courses & Classes in New York City, ISEE Courses & Classes in Denver
Popular Test Prep
SSAT Test Prep in Phoenix, MCAT Test Prep in Seattle, ISEE Test Prep in Denver, ISEE Test Prep in Houston, ISEE Test Prep in Chicago, MCAT Test Prep in San Francisco-Bay Area, SAT Test Prep in Seattle, LSAT Test Prep in Houston, LSAT Test Prep in Los Angeles, SSAT Test Prep in Denver

