Create an account to track your scores
and create your own practice tests:
Test: GED Math
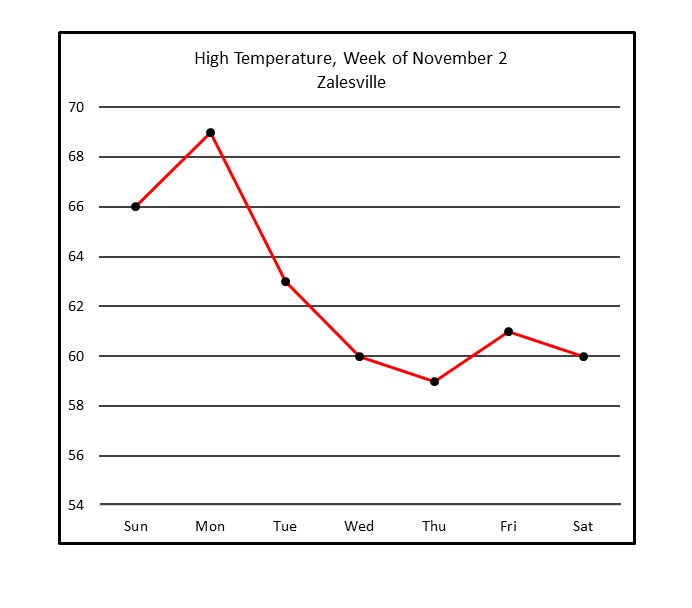
| 1. | Refer to the above line graph, which tracks the high temperature in a town over one calendar week. Of the days shown, between which two consecutive days did the peak temperature decrease the most? |
Between Wednesday and Thursday
Between Tuesday and Wednesday
Between Friday and Saturday
Between Monday and Tuesday


Popular Subjects
Math Tutors in Washington DC, Spanish Tutors in Denver, GMAT Tutors in Seattle, Computer Science Tutors in San Diego, SSAT Tutors in San Diego, Spanish Tutors in Dallas Fort Worth, ACT Tutors in Atlanta, English Tutors in Phoenix, Biology Tutors in Miami, GRE Tutors in Dallas Fort Worth
Popular Courses & Classes
GRE Courses & Classes in Dallas Fort Worth, ISEE Courses & Classes in Houston, GMAT Courses & Classes in San Diego, ACT Courses & Classes in New York City, ACT Courses & Classes in Phoenix, SSAT Courses & Classes in Atlanta, ACT Courses & Classes in Miami, LSAT Courses & Classes in Philadelphia, GMAT Courses & Classes in New York City, GRE Courses & Classes in Washington DC
Popular Test Prep
LSAT Test Prep in Washington DC, GMAT Test Prep in San Diego, ISEE Test Prep in New York City, ISEE Test Prep in Philadelphia, ACT Test Prep in New York City, GRE Test Prep in Miami, SSAT Test Prep in San Francisco-Bay Area, ACT Test Prep in Phoenix, ISEE Test Prep in Houston, LSAT Test Prep in Dallas Fort Worth

