Create an account to track your scores
and create your own practice tests:
Test: ISEE Upper Level Quantitative
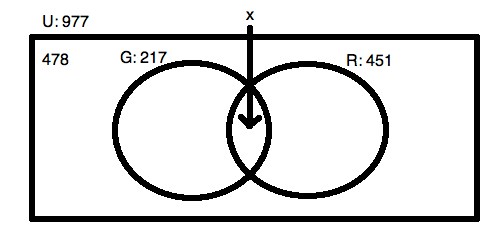
| 1. | For the Venn Diagram pictured above, what is the value |
 for the overlap of the two sets drawn as circles?


Tom
Certified Tutor
Certified Tutor
University of Wisconsin-Madison, Bachelor of Science, Atmospheric Sciences and Meteorology. Embry-Riddle Aeronautical Univers...

Mary
Certified Tutor
Certified Tutor
Oklahoma Wesleyan University, Bachelor of Science, Business Teacher Education. University of Phoenix-Oklahoma City Campus, Ma...

Popular Subjects
Computer Science Tutors in New York City, Physics Tutors in Philadelphia, Calculus Tutors in Chicago, Physics Tutors in Houston, ISEE Tutors in San Diego, English Tutors in Miami, Algebra Tutors in Phoenix, Computer Science Tutors in San Francisco-Bay Area, Spanish Tutors in Phoenix, Algebra Tutors in Washington DC
Popular Courses & Classes
Spanish Courses & Classes in Houston, GRE Courses & Classes in San Francisco-Bay Area, Spanish Courses & Classes in New York City, GMAT Courses & Classes in Atlanta, LSAT Courses & Classes in Miami, GMAT Courses & Classes in Phoenix, ACT Courses & Classes in Miami, MCAT Courses & Classes in San Francisco-Bay Area, LSAT Courses & Classes in Denver, MCAT Courses & Classes in Dallas Fort Worth
Popular Test Prep
SAT Test Prep in Seattle, MCAT Test Prep in Washington DC, LSAT Test Prep in San Diego, MCAT Test Prep in San Francisco-Bay Area, GRE Test Prep in Boston, SSAT Test Prep in Phoenix, ACT Test Prep in Miami, LSAT Test Prep in New York City, ISEE Test Prep in New York City, GRE Test Prep in San Francisco-Bay Area

