Create an account to track your scores
and create your own practice tests:
Test: SAT Math

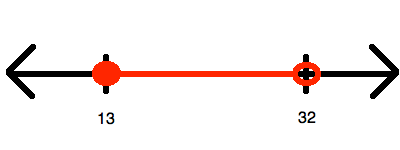
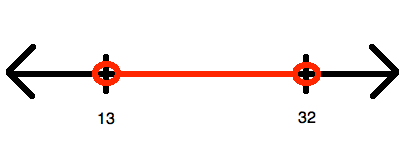
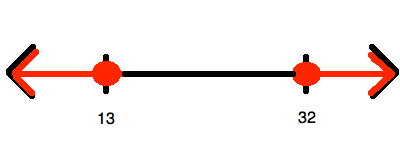
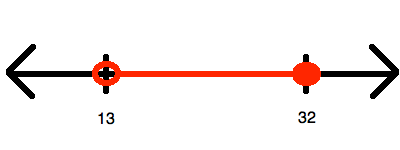
| 1. | Which of the following is a graph for the values of |
 defined by the inequality stated above?
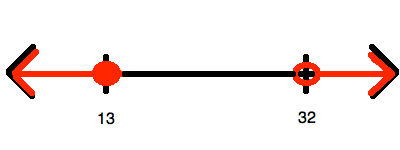


SAT Math Tutors in Top Cities:
Atlanta SAT Math Tutors, Austin SAT Math Tutors, Boston SAT Math Tutors, Chicago SAT Math Tutors, Dallas Fort Worth SAT Math Tutors, Denver SAT Math Tutors, Houston SAT Math Tutors, Kansas City SAT Math Tutors, Los Angeles SAT Math Tutors, Miami SAT Math Tutors, New York City SAT Math Tutors, Philadelphia SAT Math Tutors, Phoenix SAT Math Tutors, San Diego SAT Math Tutors, San Francisco-Bay Area SAT Math Tutors, Seattle SAT Math Tutors, St. Louis SAT Math Tutors, Tucson SAT Math Tutors, Washington DC SAT Math Tutors
Popular Courses & Classes
Spanish Courses & Classes in Washington DC, LSAT Courses & Classes in Denver, GMAT Courses & Classes in Phoenix, GMAT Courses & Classes in Washington DC, SSAT Courses & Classes in New York City, ISEE Courses & Classes in Los Angeles, LSAT Courses & Classes in Washington DC, Spanish Courses & Classes in New York City, LSAT Courses & Classes in Los Angeles, SAT Courses & Classes in Chicago

