Award-Winning Statistics Tutors
serving Los Angeles, CA
Statistics
Tutors in Los Angeles
Private 1-on-1 tutoring, weekly live classes for academic support, test prep & enrichment, practice tests and diagnostics, and more to elevate grades and test scores.
Based on 3.4M Learner Ratings
UniversitiesSchools & Universities
DeliveredHours Delivered
ProficiencyGrowth in Proficiency
Who needs tutoring?
No obligation. Takes ~1 minute.
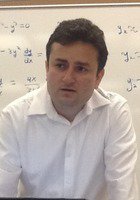
Probability distributions and hypothesis testing require a different kind of mathematical thinking than most students are used to — less computation, more interpretation. Gerardo approaches statistics by anchoring every concept in a concrete scenario, whether that's reading a p-value in context or deciding which test applies to a given dataset. His teaching certification and physics training give him a structured, evidence-driven style that clicks for students who struggle with the "why" behind statistical reasoning.
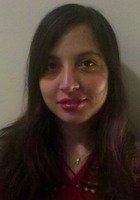
Probability distributions, hypothesis testing, and confidence intervals all hinge on understanding what the numbers actually represent — not just which formula to grab. Sarah's mathematics background at Clark University gave her the rigor to unpack statistical reasoning clearly, and her physics training means she's comfortable with real-world data that doesn't behave perfectly.
Understanding when to use a t-test versus a z-test, or why a sampling distribution behaves the way it does, requires more than formula sheets — it takes genuine statistical intuition. Brian built that intuition through his economics coursework at Caltech, where statistical analysis was a daily tool, and he walks students through each concept with concrete data examples.
Probability distributions, hypothesis testing, and confidence intervals all require a different kind of mathematical thinking — less computation, more interpretation. Mitch approaches statistics by teaching students to read what the numbers actually claim, drawing on the data analysis skills he built during his engineering degree.
Probability distributions, hypothesis testing, and confidence intervals each demand a different kind of reasoning than the algebra most students are used to. Joanne approaches statistics by grounding every formula in what it actually measures, making it easier to choose the right test and interpret results correctly.
Reading a statistics problem correctly matters as much as running the calculation, which is why Lizzy spends time on interpreting what a question actually asks before touching any formulas. She walks through probability distributions, hypothesis testing, and confidence intervals with an emphasis on understanding what the numbers mean in context.
Planning to pursue graduate work in mathematical game theory, Alain brings a probabilistic mindset to statistics that most business-econ majors don't — his math minor at UCLA meant he studied the theoretical machinery behind expected value, distributions, and hypothesis testing rather than just applying them in a spreadsheet. He teaches students to trace each statistical concept back to the underlying math so they can adapt when problems don't look like textbook examples.
The jump from calculating a mean to interpreting a confidence interval trips up students who never built intuition for what variability actually means. Mariapaz unpacks concepts like standard deviation, probability distributions, and hypothesis testing by grounding them in real data scenarios before introducing formulas. Her background teaching math across middle and high school levels means she can identify exactly where a student's conceptual understanding breaks down.
What separates a strong statistics student from a struggling one usually isn't computation — it's grasping why a particular test or measure fits a particular question. Tessa's mathematics coursework at Yale, paired with her history training where she regularly evaluates quantitative evidence in primary sources, gives her a sharp eye for the reasoning behind tools like confidence intervals and hypothesis tests. Rated 4.9 by students.
Interpreting p-values, choosing the right hypothesis test, and knowing when a confidence interval actually tells you something useful — these are the concepts that separate students who understand statistics from those just plugging into calculators. Zachary brings a researcher's perspective from his biochemistry and biophysics training, where statistical analysis was built into every experiment. Rated 5.0 by students.
Probability distributions and hypothesis testing trip students up when they try to memorize formulas without understanding what a p-value actually represents or why a sample size matters. Abismael connects statistical reasoning back to real engineering applications — quality control, experimental design, process variation — which makes abstract concepts like confidence intervals tangible. He's the kind of tutor who will quiz you with problems you haven't seen before, because that's what exams do.
Studying cognitive science at Rice required Adam to run experiments, interpret data sets, and draw conclusions from statistical tests — so he teaches statistics as a practical reasoning tool, not just a math course. Whether it's regression analysis, p-values, or probability distributions, he connects each topic to real research questions that make the material intuitive.
Probability distributions, hypothesis testing, and regression analysis all clicked for Crony during his neuroscience research at Brown, where he used statistics daily to interpret experimental data. He brings that applied perspective to tutoring sessions, showing students how each concept works in practice — not just on a problem set.
Engineering Physics at Cornell requires serious statistical reasoning — error analysis, probability distributions, hypothesis testing — so Daniel brings a practical lens to statistics rather than a purely textbook one. He walks through concepts like standard deviation, regression, and confidence intervals by tying them to real data questions, which makes the logic behind each formula click.
Kaylah's graduate work in Computational Social Science at the University of Chicago is built almost entirely on statistical methods — probability distributions, hypothesis testing, regression modeling, and data interpretation. She teaches statistics the way she actually uses it: starting with what question you're trying to answer, then selecting and applying the right tool. Her background in cognitive neuroscience research means every example she pulls from is grounded in real data.
Between her biostatistics background and hands-on research experience in Northwestern's John Rogers Lab, Ingrid knows statistics as both a classroom subject and a practical tool. She walks students through concepts like hypothesis testing, confidence intervals, and probability distributions by connecting each one to what the numbers actually mean in context.
Kathy's economics degree from Duke meant living inside datasets — regression analysis, probability distributions, hypothesis testing, and statistical inference were daily tools, not abstract concepts. She breaks down problems by connecting the math to what the numbers actually represent, which makes interpreting results feel intuitive rather than formulaic.
Emily's computational biology concentration at Cornell is essentially applied statistics — she uses probability distributions, confidence intervals, and regression analysis to interpret biological data every week. That hands-on context lets her explain statistical reasoning through concrete examples rather than abstract formulas.
A PhD in economics at Yale means Anthony doesn't just teach statistics — he relies on it daily, from econometric modeling to designing empirical studies that require careful handling of inference, sampling, and regression. His dual undergraduate background in physics and math gives him an unusual ability to trace statistical methods back to their mathematical roots, making concepts like maximum likelihood estimation or the central limit theorem genuinely intuitive. Rated 5.0 by students.
An economics degree means Maggie didn't just study statistics in a textbook — she applied distributions, hypothesis testing, and regression analysis to real datasets. She teaches students to interpret what a p-value actually tells them and how to choose the right test for a given scenario, building the kind of statistical intuition that carries through exams and research projects alike.
Testimonials
Because the right Statistics tutor makes all the difference.
Average Session Rating – Based on 3.4M Learner Ratings
Practice Statistics
Free practice tests, flashcards, and AI tutoring for Statistics
Nearby Statistics Tutors
Other Los Angeles Tutors
Related Math Tutors in Los Angeles
Frequently Asked Questions
Statistics is taught differently depending on your school's textbook and approach—some emphasize computational methods while others focus on conceptual understanding and interpretation. Tutors who work with students in Los Angeles are familiar with common curricula like AP Statistics, IB Statistics, and various high school probability & statistics courses. They can align instruction with your specific course materials and help you understand both the "how" and the "why" behind statistical concepts, whether your class emphasizes traditional frequentist methods, Bayesian thinking, or simulation-based approaches.
Statistics word problems require students to translate real-world scenarios into statistical questions, choose appropriate methods, and interpret results in context—often the hardest part for learners. A tutor can help you break down these multi-step problems by identifying what data you have, what you're trying to find, and which statistical tools apply. Through guided practice with problems from your actual coursework, tutors help you develop problem-solving strategies and confidence in tackling unfamiliar scenarios.
Statistics anxiety is common because the subject blends mathematics, logic, and interpretation—it can feel overwhelming when concepts don't click immediately. Personalized 1-on-1 instruction lets a tutor identify exactly where your understanding breaks down, whether that's probability fundamentals, sampling distributions, or hypothesis testing. By working through problems at your pace and building understanding incrementally, students often see patterns emerge and gain the confidence to tackle new problems independently. Many students discover that Statistics is far more intuitive than it initially seemed.
In Statistics, showing your work isn't just about getting the right answer—it demonstrates your reasoning, helps you avoid calculation errors, and allows your teacher or tutor to identify where misconceptions occur. Tutors help students develop the habit of clearly documenting each step: stating hypotheses, calculating test statistics, finding p-values, and writing conclusions in context. This deliberate approach not only improves grades but also deepens your understanding of why each step matters in the statistical process.
Statistics concepts are deeply interconnected—understanding sampling distributions helps you grasp confidence intervals, which connects to hypothesis testing, which relates back to probability. Many students memorize formulas without seeing these connections, making the subject feel fragmented. Tutors working with students in Los Angeles help you build a coherent mental framework by highlighting these relationships, showing how different topics serve the same underlying ideas, and helping you recognize when to apply each method. This pattern-recognition approach transforms Statistics from a collection of procedures into a unified way of thinking about data and uncertainty.
Starting tutoring early in the course is ideal—it prevents misconceptions from building up and makes cumulative topics like inference much easier to grasp. However, tutors can help at any point, whether you're struggling with foundational concepts, preparing for an AP Statistics exam, or trying to understand a specific unit. Many students find that even a few sessions focusing on problem-solving strategies or exam preparation can significantly boost performance and confidence.
Varsity Tutors connects you with expert tutors by considering your specific needs—your course level (AP, IB, honors, or introductory Statistics), which topics are giving you trouble, your learning style, and your schedule. With 276,254 students across Los Angeles's 169 school districts, tutors understand the variety of curricula and pacing in the area. You'll be matched with someone whose expertise aligns with your goals, whether that's mastering hypothesis testing, preparing for exams, or building foundational confidence in data analysis.
Let’s find your perfect tutor
Answer a few quick questions. We’ll recommend the right plan and match you with a top 5% tutor.