Award-Winning Statistics Tutors
serving Riverside, CA
Statistics
Tutors in Riverside
Private 1-on-1 tutoring, weekly live classes for academic support, test prep & enrichment, practice tests and diagnostics, and more to elevate grades and test scores.
Based on 3.4M Learner Ratings
UniversitiesSchools & Universities
DeliveredHours Delivered
ProficiencyGrowth in Proficiency
Who needs tutoring?
No obligation. Takes ~1 minute.
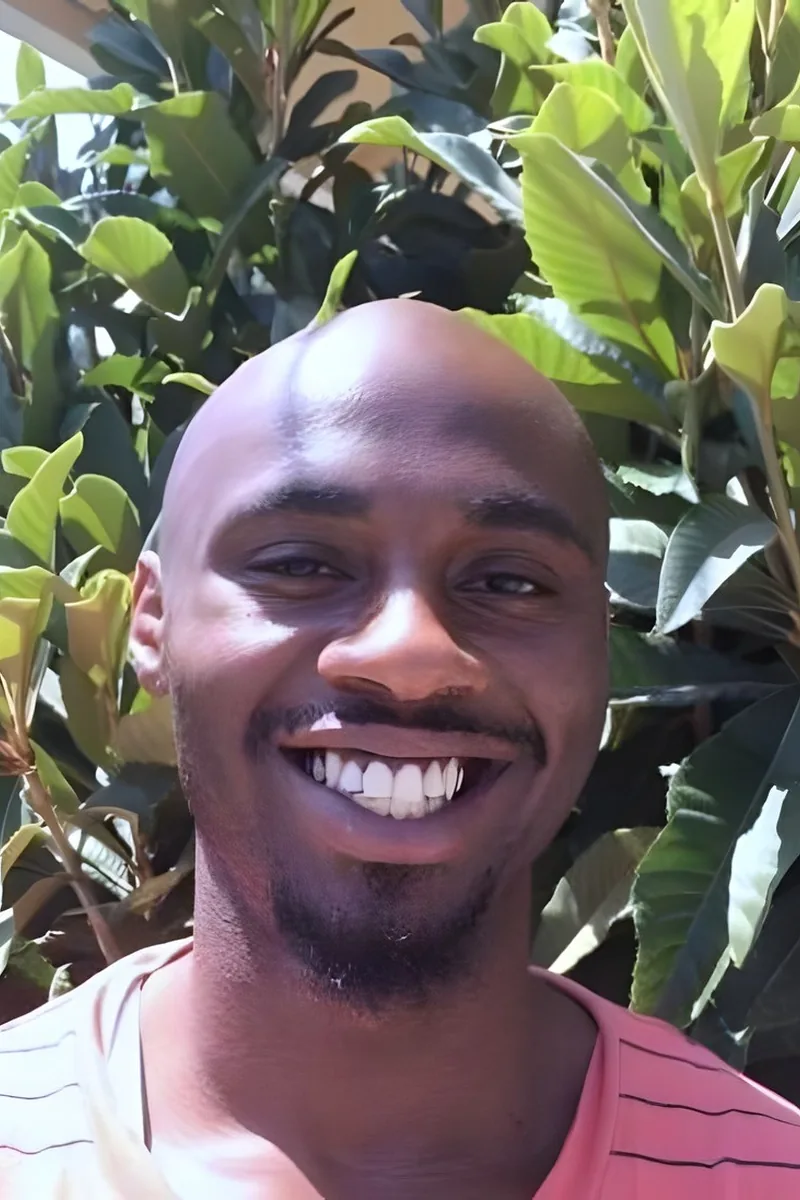
Understanding when to use a t-test versus a z-test, or why a sampling distribution behaves the way it does, requires more than formula sheets — it takes genuine statistical intuition. Brian built that intuition through his economics coursework at Caltech, where statistical analysis was a daily tool, and he walks students through each concept with concrete data examples.

Probability distributions, hypothesis testing, and confidence intervals all require a different kind of mathematical thinking — less computation, more interpretation. Mitch approaches statistics by teaching students to read what the numbers actually claim, drawing on the data analysis skills he built during his engineering degree.
Probability distributions and hypothesis testing require a different kind of mathematical thinking than most students are used to — less computation, more interpretation. Gerardo approaches statistics by anchoring every concept in a concrete scenario, whether that's reading a p-value in context or deciding which test applies to a given dataset. His teaching certification and physics training give him a structured, evidence-driven style that clicks for students who struggle with the "why" behind statistical reasoning.
Probability distributions, hypothesis testing, and confidence intervals each demand a different kind of reasoning than the algebra most students are used to. Joanne approaches statistics by grounding every formula in what it actually measures, making it easier to choose the right test and interpret results correctly.
Reading a statistics problem correctly matters as much as running the calculation, which is why Lizzy spends time on interpreting what a question actually asks before touching any formulas. She walks through probability distributions, hypothesis testing, and confidence intervals with an emphasis on understanding what the numbers mean in context.
Planning to pursue graduate work in mathematical game theory, Alain brings a probabilistic mindset to statistics that most business-econ majors don't — his math minor at UCLA meant he studied the theoretical machinery behind expected value, distributions, and hypothesis testing rather than just applying them in a spreadsheet. He teaches students to trace each statistical concept back to the underlying math so they can adapt when problems don't look like textbook examples.
The jump from calculating a mean to interpreting a confidence interval trips up students who never built intuition for what variability actually means. Mariapaz unpacks concepts like standard deviation, probability distributions, and hypothesis testing by grounding them in real data scenarios before introducing formulas. Her background teaching math across middle and high school levels means she can identify exactly where a student's conceptual understanding breaks down.
Probability distributions, hypothesis testing, and confidence intervals all hinge on understanding what the numbers actually represent — not just which formula to grab. Sarah's mathematics background at Clark University gave her the rigor to unpack statistical reasoning clearly, and her physics training means she's comfortable with real-world data that doesn't behave perfectly.
Designing and optimizing light filters for optical multiplexers at Norfolk State required Dennis to apply statistical methods to real engineering data — fitting distributions, quantifying uncertainty, and interpreting experimental results. He teaches statistics with that practitioner's perspective, making topics like standard deviation, probability, and regression feel like problem-solving tools rather than abstract formulas.
Understanding statistics means learning to think critically about variability, probability, and what data can actually tell you. Tashina applies statistical methods daily in her PhD research in brain sciences — hypothesis testing, confidence intervals, regression — and she unpacks each concept by connecting it to the kind of real analysis questions that make the material stick.
Jonathan holds an MS in Statistics, which means probability distributions, hypothesis testing, and regression analysis aren't just textbook topics for him — they're the core of his graduate training. He breaks down intimidating formulas like Bayes' theorem or ANOVA tables by connecting them to the real-world questions they were designed to answer.
Studying mathematical economic analysis means Kenan lives in the world of probability distributions, hypothesis testing, and regression — the exact toolkit a statistics course demands. He unpacks concepts like p-values and confidence intervals by tying each one to a concrete decision it would inform, so the reasoning sticks long after the formula sheet is gone.
Probability distributions, hypothesis testing, and regression analysis all require a kind of structured thinking that Florence sharpened through her computer science degree at Duke. She teaches statistics by grounding each concept in real data scenarios — building intuition for what a p-value actually means before diving into formulas. Her 5.0 client rating speaks to how well that approach lands.
Probability distributions, hypothesis testing, and confidence intervals make a lot more sense when you've actually used them to analyze real data. Emma applied statistical methods throughout her biology research at Duke — including fieldwork on Hawaiian monk seals — so she teaches stats as a practical tool rather than an abstract formula sheet. Rated 4.9 by students.
Interpreting p-values, choosing the right hypothesis test, and knowing when a confidence interval actually tells you something useful — these are the concepts that separate students who understand statistics from those just plugging into calculators. Zachary brings a researcher's perspective from his biochemistry and biophysics training, where statistical analysis was built into every experiment. Rated 5.0 by students.
A PhD statistician who also holds a biomedical engineering degree, Sam teaches introductory and intermediate statistics with an unusual amount of real-world context. Whether the topic is hypothesis testing, confidence intervals, or regression, he unpacks the logic behind each method so students can interpret results critically, not just run calculations.
During her psychology degree at Penn, Brittany used statistics constantly — hypothesis testing, probability distributions, regression analysis — as core tools for understanding research. She also tutored middle schoolers in introductory statistics as a volunteer in West Philadelphia, so she's comfortable adjusting her explanations whether someone is learning mean and median or wrestling with p-values.
A PhD in economics at Yale means Anthony doesn't just teach statistics — he relies on it daily, from econometric modeling to designing empirical studies that require careful handling of inference, sampling, and regression. His dual undergraduate background in physics and math gives him an unusual ability to trace statistical methods back to their mathematical roots, making concepts like maximum likelihood estimation or the central limit theorem genuinely intuitive. Rated 5.0 by students.
Probability distributions, hypothesis testing, and regression analysis click faster when a tutor can show where these tools get deployed in practice. Firas uses statistics daily in his machine learning research at Princeton, which means he can walk through concepts like Bayesian inference or p-values with real datasets and concrete examples instead of abstract formulas.
A Quantitative Methods minor at Vanderbilt means Heather spent semesters immersed in regression analysis, hypothesis testing, and probability — the exact material that trips up most statistics students. She teaches the reasoning behind each test so students can choose the right method on their own, not just follow a decision flowchart. Her 4.9 rating speaks to that approach.
Testimonials
Because the right Statistics tutor makes all the difference.
Average Session Rating – Based on 3.4M Learner Ratings
Practice Statistics
Free practice tests, flashcards, and AI tutoring for Statistics
Nearby Statistics Tutors
Other Riverside Tutors
Related Math Tutors in Riverside
Frequently Asked Questions
Statistics is taught differently across textbooks and curricula—some focus heavily on probability first, while others emphasize data analysis and inference. Tutors who work with students in Riverside understand the various approaches used across the 7 school districts and can align their instruction with what students are learning in class. During an initial conversation, a tutor will ask about your student's specific course, textbook, and teacher's emphasis so they can reinforce the exact concepts being covered, whether that's hypothesis testing, confidence intervals, or exploratory data analysis.
Statistics word problems require students to translate real-world scenarios into mathematical language—identifying what the question is actually asking, determining which statistical method applies, and then interpreting results in context. Many students can execute calculations but struggle with the conceptual layer of understanding when and why to use a particular approach. Personalized tutoring helps students develop a systematic problem-solving strategy: breaking down the problem, identifying key information, choosing the right test or analysis, and explaining what the answer means in plain language. This builds both confidence and genuine understanding.
Math anxiety—including Statistics anxiety—is real and common, but 1-on-1 instruction is particularly effective at addressing it. Working with a tutor creates a low-pressure environment where students can ask questions without judgment, work through problems at their own pace, and see immediate, personalized feedback. Tutors can also help reframe Statistics from abstract formulas to practical problem-solving, showing students how the concepts connect to real data and decisions they care about. Over time, this combination of understanding and supportive instruction typically reduces anxiety and builds genuine confidence.
Procedural understanding means knowing how to plug numbers into a formula or use software to get an answer. Conceptual understanding means knowing why you're using that particular method, what assumptions it requires, and what the result actually tells you. Many Statistics courses emphasize procedures, but deeper learning requires connecting those steps to the underlying concepts—like understanding that a p-value is not the probability your hypothesis is true, or recognizing what a confidence interval actually captures. Tutors help students bridge this gap by asking guiding questions, showing patterns across different problems, and explaining the 'why' behind each step.
Showing work in Statistics is crucial—not just for earning partial credit, but for developing clear thinking and catching errors. Beyond calculations, students should document their reasoning: stating their null and alternative hypotheses, identifying which test they're using and why, checking that conditions are met (like normality or independence), and interpreting results in context. Teachers across Riverside's school districts look for this evidence of understanding. Tutors can teach students a standardized approach to organizing their work—clearly labeling each step, explaining decisions, and answering 'what does this mean?'—which strengthens both their problem-solving process and their grades.
Graphing in Statistics goes beyond basic plotting—students need to choose appropriate displays (histograms vs. boxplots vs. scatterplots), interpret what they see, and recognize when visualizations can be misleading. Many students can create a graph using technology but don't understand what features to look for or what story the data tells. Additionally, interpreting others' graphs and summaries requires critical thinking about sample size, context, and bias. Tutors help students develop this visual literacy by connecting graphs back to the underlying data and distributions, asking them to make observations and predictions, and teaching them to identify the most useful display for different types of questions.
Yes. AP Statistics has a specific curriculum and exam format that differs from standard high school Statistics. Students need to master both the conceptual foundations and the communication skills required on the exam—interpreting data, designing studies, understanding inference, and explaining results clearly. Varsity Tutors connects students in Riverside with tutors who specialize in AP Statistics, helping them identify weak areas, practice free-response questions, develop organized problem-solving approaches, and build confidence for test day. Whether a student is just starting the course or reviewing before the exam, personalized instruction is proven to accelerate learning and improve performance.
Let’s find your perfect tutor
Answer a few quick questions. We’ll recommend the right plan and match you with a top 5% tutor.