Award-Winning Statistics Tutors
serving Minneapolis, MN
Statistics
Tutors in Minneapolis
Private 1-on-1 tutoring, weekly live classes for academic support, test prep & enrichment, practice tests and diagnostics, and more to elevate grades and test scores.
Based on 3.4M Learner Ratings
UniversitiesSchools & Universities
DeliveredHours Delivered
ProficiencyGrowth in Proficiency
Who needs tutoring?
No obligation. Takes ~1 minute.
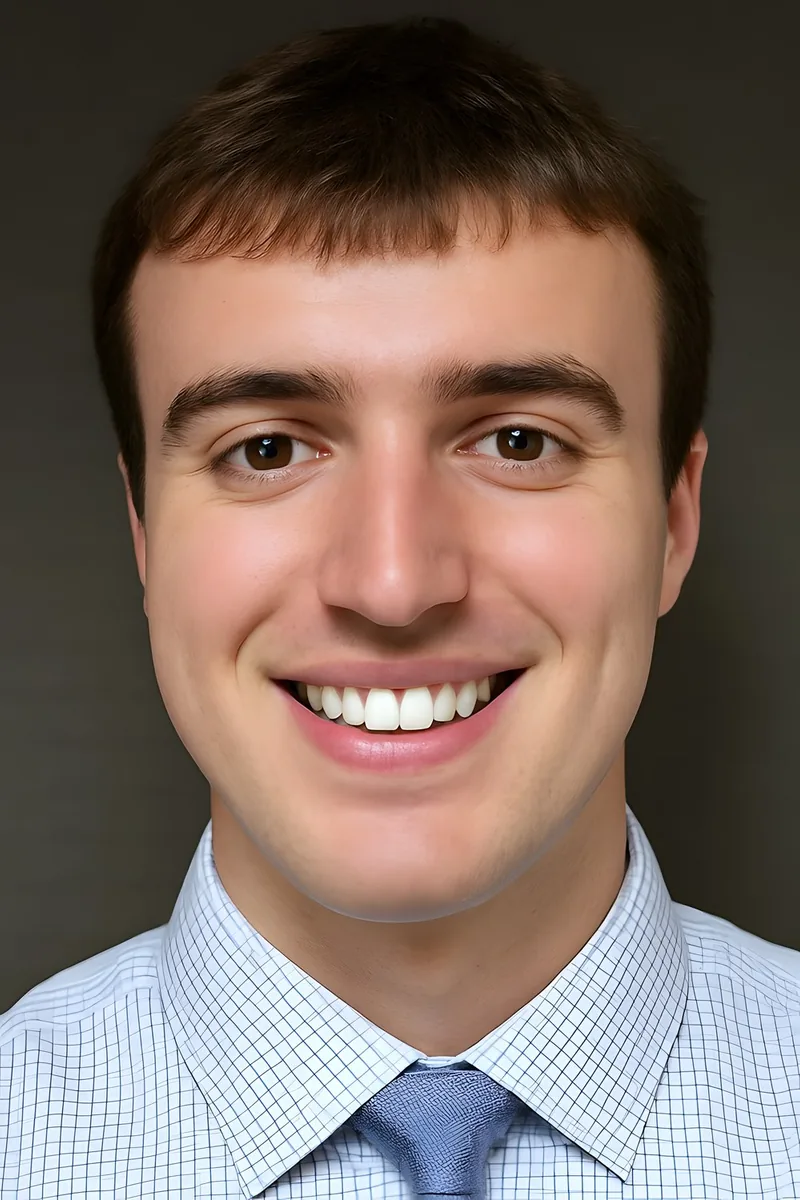
Econometrics training at Carleton College gave Reed a daily working relationship with probability distributions, hypothesis testing, regression analysis, and confidence intervals — statistics wasn't just a course for him, it was the backbone of his degree. He unpacks concepts like p-values and standard deviation using real datasets and plain language, so the logic behind each formula actually registers.
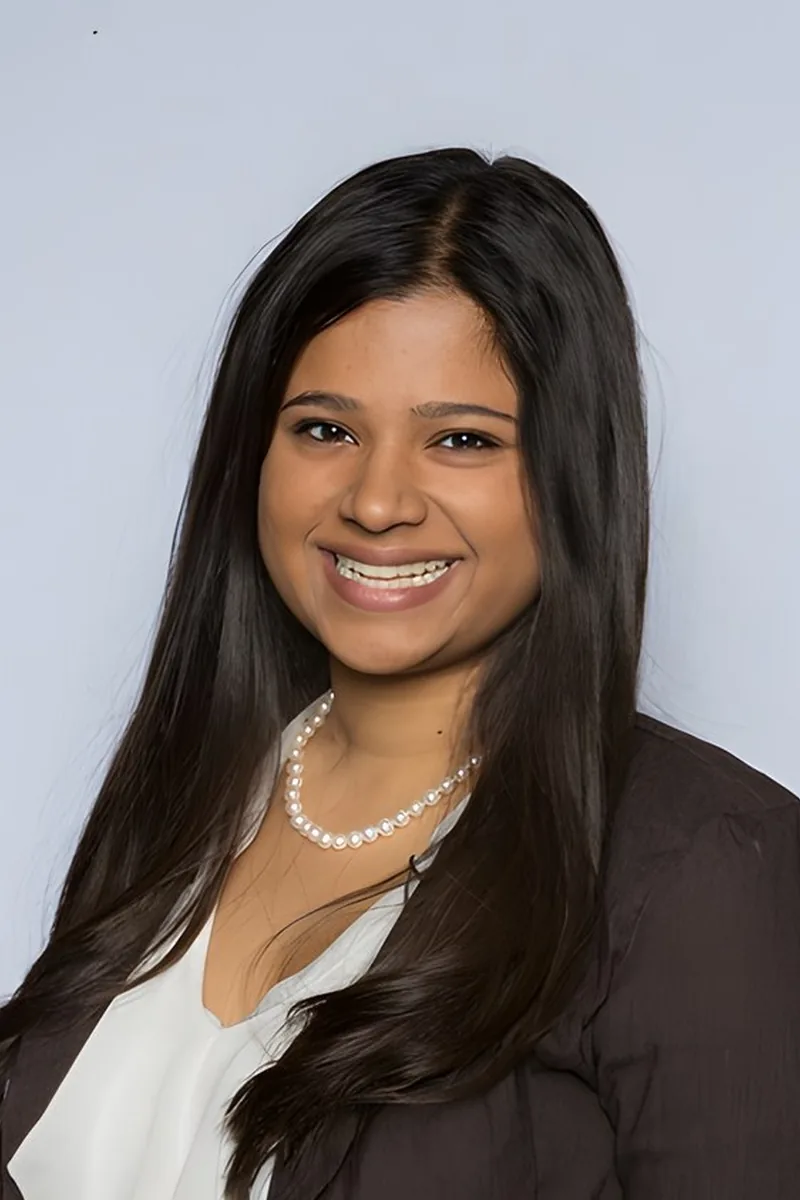
Every genetics course leans heavily on statistics — chi-square tests, probability distributions, Hardy-Weinberg calculations — so Jaya doesn't just know the formulas, she's used them to interpret real experimental data. That experience makes her particularly effective at teaching students how to set up hypothesis tests and understand what p-values actually mean. She approaches stats as a reasoning tool rather than a collection of procedures to memorize.
Biomedical engineering runs on statistics — from analyzing clinical trial data to fitting regression models to experimental results — so Emily applies these tools constantly in her own coursework. She unpacks concepts like probability distributions, standard error, and p-values by tying them to concrete scenarios rather than leaving them as abstract formulas. She holds a 5.0 rating from students.
David's concentration in Economics at Pomona means he uses statistics constantly — regression analysis, probability distributions, and hypothesis testing are tools he applies to real policy questions, not just textbook exercises. He teaches students to interpret what a p-value or confidence interval actually tells you, which is the skill that separates surface-level answers from genuine understanding.
Cognitive psychology research runs on statistics — t-tests, ANOVAs, regression models, effect sizes — and Danelle has used all of them extensively throughout her PhD work. She teaches statistical reasoning by connecting each test to the real question it answers, so concepts like p-values and confidence intervals actually make sense instead of feeling like arbitrary formulas.
Understanding why a confidence interval narrows with a larger sample, or when a t-test applies instead of a z-test, requires more than plugging into formulas. Ella approaches statistics by making sure students can interpret what their calculations mean in context — a skill her physics training reinforced through years of analyzing experimental data and quantifying uncertainty.
Emily's computational biology concentration at Cornell is essentially applied statistics — she uses probability distributions, confidence intervals, and regression analysis to interpret biological data every week. That hands-on context lets her explain statistical reasoning through concrete examples rather than abstract formulas.
Studying economics at the undergraduate level means living inside probability distributions, hypothesis tests, and regression models — so Laura treats statistics as a language she already speaks fluently. She breaks down concepts like p-values and confidence intervals by tying them to concrete decision-making scenarios rather than abstract formulas. Her 5.0 rating speaks to how clearly that approach translates for students.
A neurobiology degree from Harvard meant designing experiments, interpreting data sets, and living inside statistical analysis for four years. Katherine teaches statistics with that research lens — connecting probability distributions, hypothesis testing, and confidence intervals to how they're actually used in published studies. Rated 5.0 by students.
Working as a research assistant in Yale's cognitive neuroscience lab meant Emily ran statistical analyses regularly — hypothesis testing, probability distributions, and interpreting p-values were part of her daily routine. That hands-on experience makes her especially effective at explaining why a statistical method works, not just how to execute it on a calculator.
Probability distributions, hypothesis testing, and confidence intervals make a lot more sense when you've actually used them to analyze real data. Emma applied statistical methods throughout her biology research at Duke — including fieldwork on Hawaiian monk seals — so she teaches stats as a practical tool rather than an abstract formula sheet. Rated 4.9 by students.
Engineering Physics at Cornell requires serious statistical reasoning — error analysis, probability distributions, hypothesis testing — so Daniel brings a practical lens to statistics rather than a purely textbook one. He walks through concepts like standard deviation, regression, and confidence intervals by tying them to real data questions, which makes the logic behind each formula click.
The hardest part of statistics for most students isn't the math — it's interpreting what a p-value or confidence interval actually means in context. Vy's training in cognitive studies at Vanderbilt, which is heavily research-methods driven, means she's spent real time designing studies and running analyses. She unpacks concepts like distributions, hypothesis testing, and regression by tying them to concrete research questions.
Kaylah's graduate work in Computational Social Science at the University of Chicago is built almost entirely on statistical methods — probability distributions, hypothesis testing, regression modeling, and data interpretation. She teaches statistics the way she actually uses it: starting with what question you're trying to answer, then selecting and applying the right tool. Her background in cognitive neuroscience research means every example she pulls from is grounded in real data.
Probability distributions, hypothesis testing, confidence intervals — statistics asks students to think in a fundamentally different way than most math courses. Elliot spent years running statistical analyses on neural data during his PhD research, which means he can show exactly how concepts like p-values and regression actually function in practice, not just on a formula sheet.
Understanding probability distributions or interpreting a confidence interval requires a different kind of thinking than most math classes demand. Dillon spent years applying statistics in engineering contexts — quality control, data analysis, experimental design — and he brings that applied lens to topics like standard deviation, z-scores, and regression so students see what the numbers actually tell them.
Studying Comparative Human Development at the doctoral level means Gabriel has spent years designing studies, interpreting data sets, and running statistical analyses firsthand. He teaches statistics by grounding concepts like probability distributions, hypothesis testing, and regression in real research questions rather than abstract formulas. That practical lens makes the subject click for students who struggle with the textbook approach.
Most students walk into statistics expecting another math class and get blindsided by the emphasis on interpretation — explaining what a confidence interval actually means, or why correlation isn't causation. Amber tackles that interpretive layer head-on, teaching students to read context before crunching numbers. Her theater background gives her a knack for making abstract concepts like probability distributions feel concrete and memorable.
Testimonials
Because the right Statistics tutor makes all the difference.
Average Session Rating – Based on 3.4M Learner Ratings
Practice Statistics
Free practice tests, flashcards, and AI tutoring for Statistics
Nearby Statistics Tutors
Other Minneapolis Tutors
Related Math Tutors in Minneapolis
Frequently Asked Questions
Statistics is taught differently depending on whether your school uses a traditional AP Statistics curriculum, integrated math pathway, or introductory college-level approach. Tutors connect with students to understand their specific textbook, course structure, and teacher's emphasis—whether that's probability theory, data analysis, hypothesis testing, or statistical software. This ensures tutoring reinforces exactly what's being taught in class rather than introducing conflicting methods.
Statistics word problems require students to translate real-world scenarios into mathematical language, identify which statistical test or concept applies, and interpret results in context—that's three distinct skills. Many students can calculate correctly but struggle to determine *what* to calculate or explain *why* their answer makes sense. Personalized tutoring helps students develop a systematic approach to breaking down problems, recognizing patterns across different problem types, and building confidence in their interpretation of results.
Memorizing a formula for standard deviation or correlation doesn't help students understand *why* these measures matter or *when* to use them. True conceptual understanding means seeing how data distributions connect to probability, recognizing that correlation isn't causation, and understanding sampling variability. Tutors help students move beyond plug-and-chug calculation to see the bigger picture—the patterns, assumptions, and real-world implications behind each concept.
In Statistics, showing work is critical because it demonstrates your reasoning, not just your final answer. Teachers and AP graders want to see: the problem setup, which test or method you chose and why, the calculations or software output, and your interpretation in context. Tutors help students develop the habit of explaining each step clearly, which catches errors early and earns partial credit even if the final answer is wrong—especially valuable on AP exams where communication is heavily weighted.
Statistics anxiety often stems from feeling overwhelmed by new concepts, unfamiliar terminology, or the jump from algebra to probabilistic thinking. One-on-one instruction lets tutors slow down, use concrete examples, and celebrate small wins—like finally understanding why we divide by n-1 in sample standard deviation or seeing how a confidence interval actually works. Regular practice with immediate feedback and personalized encouragement transforms Statistics from intimidating to manageable.
Students need to create accurate graphs (histograms, boxplots, scatterplots, normal curves) *and* interpret what they show about distributions, outliers, relationships, and variability. Many students can plot points but miss what the shape tells them. Tutors help students develop a visual intuition—recognizing skewness, identifying clusters, spotting unusual patterns—and practice translating between graphs and numerical summaries like mean, median, and standard deviation.
Hypothesis testing is notoriously counterintuitive: students often misunderstand what a p-value actually represents or confuse the null and alternative hypotheses. Tutors break this down step-by-step, using simulations and real data to show why we test the null hypothesis, what probability we're actually calculating, and how to interpret results without over-claiming. This conceptual clarity makes the entire framework—from assumptions to conclusions—make sense.
In your first session, a tutor will ask about your course (AP Statistics, intro college stats, or other), current topics, specific challenges, and upcoming assessments. You might work through a problem together to identify where understanding breaks down—whether it's the concept, the calculation, or the interpretation. This conversation helps the tutor create a personalized plan focused on your biggest gaps and goals, whether that's improving test scores, understanding difficult units, or building overall confidence.
Let’s find your perfect tutor
Answer a few quick questions. We’ll recommend the right plan and match you with a top 5% tutor.