Award-Winning Statistics Tutors
serving Mesa, AZ
Statistics
Tutors in Mesa
Private 1-on-1 tutoring, weekly live classes for academic support, test prep & enrichment, practice tests and diagnostics, and more to elevate grades and test scores.
Based on 3.4M Learner Ratings
UniversitiesSchools & Universities
DeliveredHours Delivered
ProficiencyGrowth in Proficiency
Who needs tutoring?
No obligation. Takes ~1 minute.
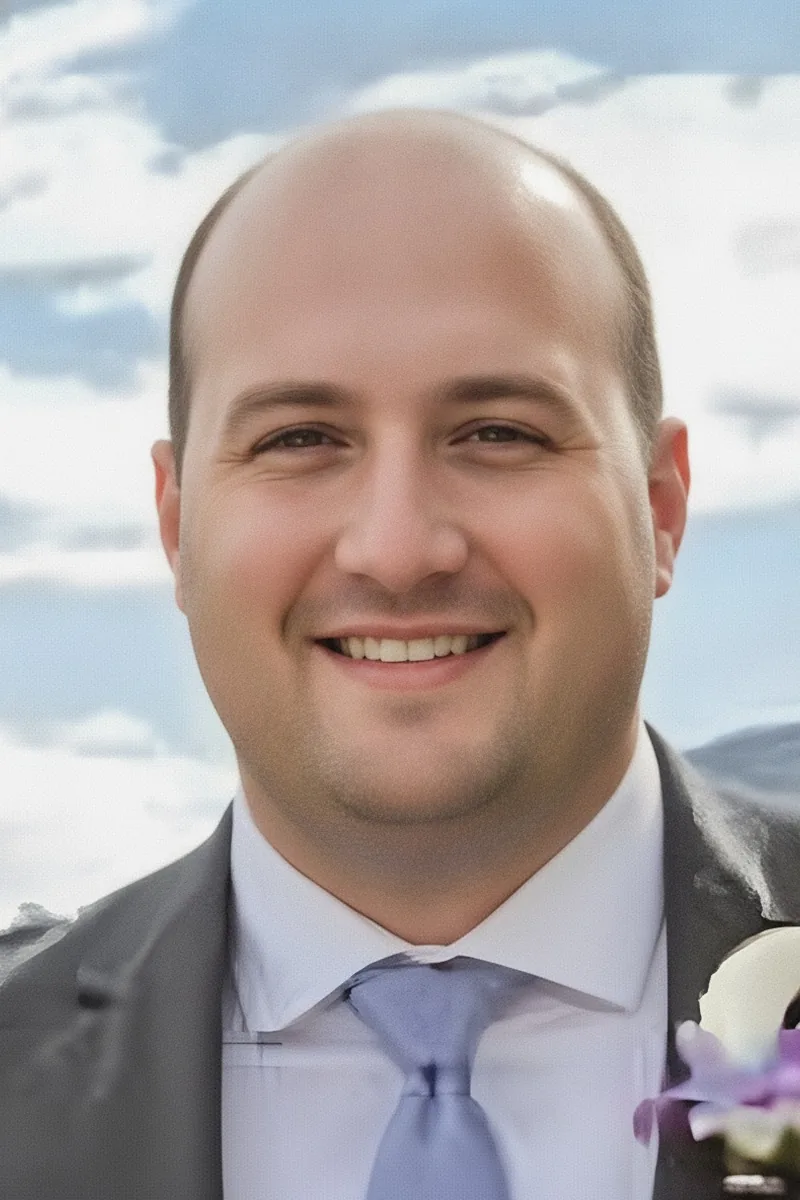
Two master's degrees in accountancy gave Steven a daily working relationship with data — probability distributions, hypothesis testing, and regression analysis are part of how he thinks, not just topics in a textbook. He unpacks statistical concepts by tying them to concrete scenarios, so students grasp not only how to run a calculation but what the result actually means.
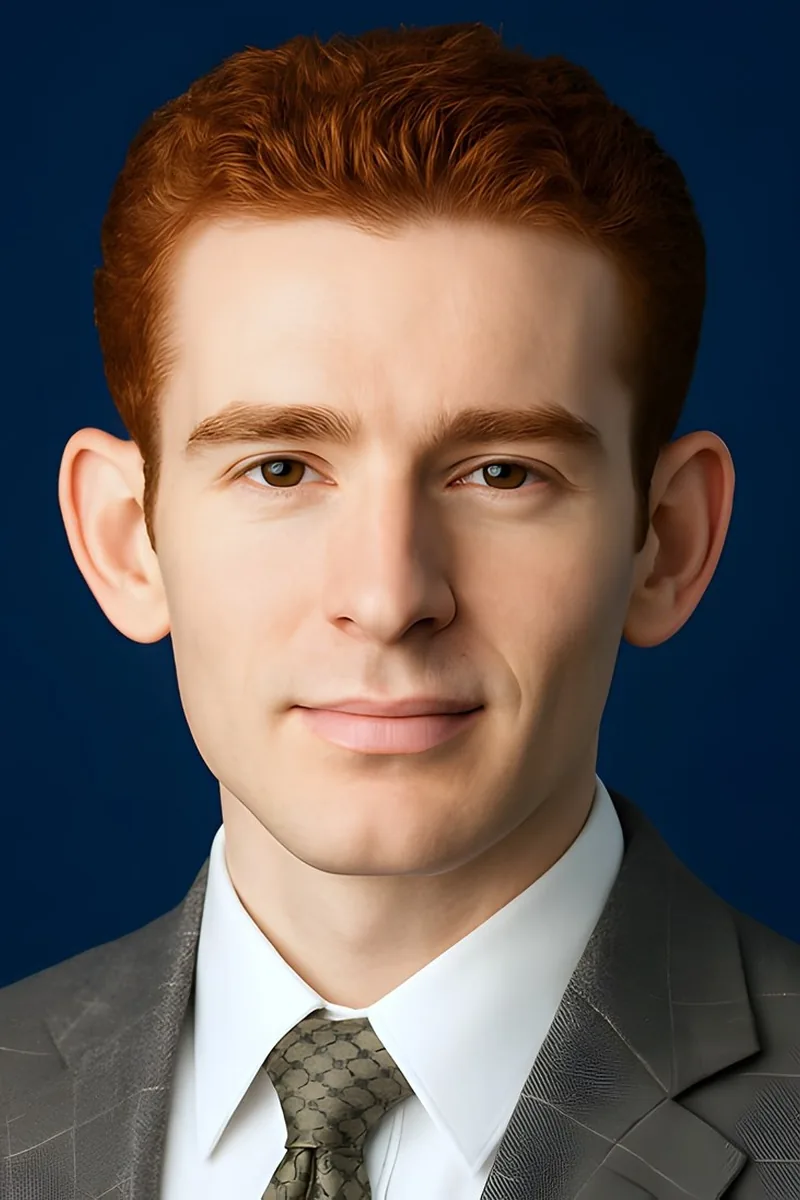
Between his MBA coursework in quantitative analysis and his International Relations training in interpreting data-driven research, Spencer has applied statistics in contexts most tutors haven't. He unpacks concepts like probability distributions, hypothesis testing, and regression by tying them to real decisions — market forecasts, polling data, policy analysis — so the formulas carry actual meaning. That practical lens makes the subject stick for students who struggle with purely theoretical instruction.
A biochemistry degree from Arizona State meant Charles spent years designing experiments, analyzing distributions, and running hypothesis tests on real data — statistics wasn't just a course, it was a daily tool. He teaches concepts like confidence intervals, p-values, and regression by grounding them in what the numbers actually mean for decision-making. Students walk away understanding not just how to compute a standard deviation but why it matters.
I am a recent graduate of the University of Arizona, with a BS in Biology and minors in Mathematics and Biochemistry. I am currently working on computer coding and enjoy tutoring students, specializing in test preparation for the ACT, SAT, and GRE.
Psychology research runs on statistics, and Robert has spent years immersed in hypothesis testing, regression analysis, ANOVA, and effect sizes for peer-reviewed publications. He teaches statistical concepts through real research questions — why you'd choose a t-test over a chi-square, or what a p-value actually tells you — so the logic behind each method clicks, not just the formula.
As a graduate researcher in anthropology, Amanda designs studies, runs statistical tests, and interprets p-values as part of her actual work — so she teaches statistics as a decision-making process, not just formula application. She's especially sharp on probability distributions, hypothesis testing, and knowing which test to use when. Her 4.9 rating speaks to how clearly she breaks down these concepts.
A psychology background turns out to be surprisingly useful for teaching statistics — Jacob studied research design and data analysis extensively during his undergraduate work, so he understands probability distributions, hypothesis testing, and regression in the context of real experiments. He walks through problems by asking what the data actually means before jumping into formulas, which makes the math feel purposeful rather than abstract.
Hypothesis testing clicks faster when you understand what the math is actually doing — why you're computing a test statistic, what the p-value measures, and how sample size shapes your conclusions. Madeleine's applied math degree means she can unpack the probability theory behind each procedure while keeping the focus on practical interpretation. She holds a 5.0 rating from students.
Before teaching, Chris worked as a scientist and analyst at NASA, where statistical methods — probability distributions, hypothesis testing, regression analysis — were essential for interpreting observational data from space missions. He brings that real-world data literacy into his statistics instruction, connecting textbook formulas to the kind of reasoning they were actually designed for.
As the peer tutor for a college statistics course at Trinity University, Lindsey spent semesters walking classmates through probability distributions, hypothesis testing, and regression analysis. Her neuroscience background means she's comfortable with the kind of data interpretation and statistical reasoning that many students find intimidating. She translates dense formulas into intuitive language — the approach that earned her a 5.0 rating.
Understanding the difference between a sample mean and a population parameter — or knowing when to reach for a t-test versus a z-test — requires more than memorizing formulas. Geoffrey approaches statistics through real data interpretation, walking students through probability distributions, hypothesis testing, and confidence intervals with an engineer's emphasis on what the numbers actually mean.
Probability distributions, hypothesis testing, and confidence intervals each require a different kind of thinking than most math courses demand — more interpretation, less pure computation. Adrian tackles statistics by walking through what each number actually tells you about a dataset before touching any formulas. His engineering training, where statistical analysis informs real design decisions, keeps lessons grounded in practical meaning.
Probability distributions, hypothesis testing, and confidence intervals all hinge on understanding what the numbers actually represent — not just which formula to use. Jared's quantitative reasoning background and analytical mindset let him unpack the logic behind each statistical method so students can interpret results, not just compute them.
Cameron spent years running statistical analyses on genetic datasets during his PhD research, so concepts like probability distributions, hypothesis testing, and regression aren't theoretical for him — they're daily tools. He teaches statistics by connecting each method to the kind of question it actually answers, which makes the reasoning behind formulas far easier to retain.
Hello! I'm Varun Krishnamurthi, a college student studying Aerospace Engineering, and I'm currently available to help students in grades K-12 with any academic troubles they may have. I'm a National Merit Scholar with a 35 ACT score, and I have years of experience tutoring in math. I can cover a variety of subjects ranging from elementary math, to pre-Algebra, all the way up to Calculus. I also specialize in test prep, especially relating to the ACT and SAT. Furthermore, I have multiple 5 star reviews from previous students, so you can guarantee that you'll be in good hands!
Studying psychology at the graduate level at NYU means Chris runs statistical analyses constantly — t-tests, ANOVA, confidence intervals, and regression modeling aren't abstract textbook topics for him. He explains statistics through real research scenarios, which makes distributions and p-values far more concrete than a formula sheet ever could. That practical grounding is a big reason students rate him 5.0.
Special education training reshapes how Maurice teaches a subject like statistics — instead of rushing to formulas, he builds each idea (say, what a p-value actually claims, or why a sample size changes your confidence interval) through carefully sequenced steps tailored to how a particular student processes information. That deliberate pacing turns topics like hypothesis testing and probability from overwhelming to manageable, especially for students who've struggled with math in traditional classroom settings.
There's a big difference between plugging numbers into a formula for standard deviation and actually understanding what a sampling distribution tells you. Adam earned his Master's in Statistics, so he unpacks concepts like confidence intervals, regression assumptions, and p-values with the depth of someone who uses them daily in his own research.
Probability distributions, hypothesis testing, and regression analysis each require a different kind of thinking than most math courses demand. Daniel approaches statistics through real-world data interpretation, leaning on the analytical rigor of his engineering background to make concepts like p-values and confidence intervals concrete rather than formulaic.
Interpreting p-values, choosing the right hypothesis test, and understanding what a confidence interval actually means — these are the concepts where Statistics shifts from number-crunching to critical thinking. Teresa's psychology background at Notre Dame required heavy coursework in statistical methods, so she teaches these ideas with the fluency of someone who's applied them to real research data. She holds a 4.9 rating across her students.
Running experiments in a UC Berkeley biochemistry lab taught Yuxuan that statistics isn't just a math class — it's how you decide whether your data actually means something. She brings that perspective to topics like probability distributions, regression analysis, and hypothesis testing, grounding each concept in real scenarios so the formulas carry meaning.
Angie's psychology degree required heavy coursework in statistics — designing experiments, interpreting p-values, running regressions — so she teaches the subject from the perspective of someone who actually uses it. She's especially good at demystifying probability distributions and hypothesis testing for students who feel more comfortable with words than numbers.
I'm not teaching biology to undergraduate majors at ASU, I research topics in aquatic ecology. Understanding the connectedness and patterns of environmental processes in aquatic ecosystems drives my passion to become an ecologist!
I'm always trying out new techniques that match the unique strengths of each individual student. I look forward to helping you reach your goals, whether it's writing an essay, practicing Spanish or learning calculus!
I am a graduate of the Creighton University School of Medicine where I received my M.D. I received my Bachelor's of Science in Biomedical Sciences with a minor in Philosophy at Marquette University in 2018. During my time at Marquette, I tutored General Biology and General Chemistry, and I was a teaching assistant for Organic Chemistry lab. Not only did I enjoy teaching students my age, but I also pursued teaching opportunities for younger students in high school and middle school. I was a gross anatomy instructor for high school students taking tours through the cadaver labs and I was one of the founders of the Marquette Brain Brigade, where a group of undergraduate students came up with demos/lessons in neuroscience to teach middle school students. Moreover, I sought out private tutoring opportunities at a company called Huntington Learning Center both during undergrad and during medical school where I tutored a wide variety of subjects, including ACT/SAT, for virtually all age groups. I am very comfortable teaching various subjects and ages, and I am a laid back and flexible person. The subjects I am most comfortable teaching would be the sciences anywhere from the basic level to graduate school level. I am so grateful for the educators that allowed me to pursue my dream of becoming a doctor, and I would love to pass it on and help younger students achieve their goals.
Most students memorize the formulas for z-scores or standard deviation without ever seeing where they come from — Kathleen's math degree from Washington University means she can derive them from scratch and explain each piece along the way. She treats every statistics concept as an extension of the algebra and calculus her students already know, which makes new material feel like a logical next step rather than a disconnected set of rules.
Yi's graduate training in research and experimental psychology required heavy use of statistical methods — from hypothesis testing and ANOVA to regression modeling and interpreting p-values in published studies. That hands-on experience with real data analysis means she teaches statistics as a tool for answering questions, not just a set of formulas to memorize.
Between her sociology research in undergrad and her MBA coursework, Krupa has run enough regressions, hypothesis tests, and probability models to know exactly where students get tripped up. She tackles the conceptual side — why you'd choose a t-test over a z-test, what a p-value actually means — so the formulas stop feeling arbitrary. Her 4.9 rating speaks to how clearly she communicates these ideas.
Most students can plug numbers into a standard deviation formula — the harder part is interpreting what the result actually means in context. Joshitha approaches statistics by connecting every calculation to real-world reasoning: why a confidence interval narrows, what a p-value does and doesn't tell you. Her engineering background at Johns Hopkins means she uses statistical thinking constantly and can show students where these ideas live outside the textbook.
Kathy's economics degree from Duke meant living inside datasets — regression analysis, probability distributions, hypothesis testing, and statistical inference were daily tools, not abstract concepts. She breaks down problems by connecting the math to what the numbers actually represent, which makes interpreting results feel intuitive rather than formulaic.
Understanding when to use a t-test versus a z-test, or why a sampling distribution behaves the way it does, requires more than formula sheets — it takes genuine statistical intuition. Brian built that intuition through his economics coursework at Caltech, where statistical analysis was a daily tool, and he walks students through each concept with concrete data examples.
A biology degree from UIUC means Todd spent years designing experiments, interpreting data sets, and running statistical tests — skills he now brings directly to tutoring statistics. He unpacks concepts like probability distributions, hypothesis testing, and standard deviation by grounding them in real data scenarios rather than abstract formulas.
Probability distributions and hypothesis testing trip students up when they try to memorize formulas without understanding what a p-value actually represents or why a sample size matters. Abismael connects statistical reasoning back to real engineering applications — quality control, experimental design, process variation — which makes abstract concepts like confidence intervals tangible. He's the kind of tutor who will quiz you with problems you haven't seen before, because that's what exams do.
During her psychology degree at Penn, Brittany used statistics constantly — hypothesis testing, probability distributions, regression analysis — as core tools for understanding research. She also tutored middle schoolers in introductory statistics as a volunteer in West Philadelphia, so she's comfortable adjusting her explanations whether someone is learning mean and median or wrestling with p-values.
As an economics major at Yale, Conor uses statistical methods constantly — regression analysis, probability distributions, hypothesis testing — so he teaches statistics as a practical toolkit rather than an abstract set of formulas. He's especially sharp at walking through the logic behind concepts like p-values and confidence intervals, which tend to confuse students who try to memorize procedures without understanding what the numbers actually mean.
Most students walk into statistics expecting another math class and get blindsided by the emphasis on interpretation — explaining what a confidence interval actually means, or why correlation isn't causation. Amber tackles that interpretive layer head-on, teaching students to read context before crunching numbers. Her theater background gives her a knack for making abstract concepts like probability distributions feel concrete and memorable.
Studying economics at Brown meant Carter lived inside datasets — running regressions, testing hypotheses, and interpreting distributions long before he started tutoring. That firsthand experience makes him especially effective at teaching concepts like standard deviation, normal models, and conditional probability in ways that feel grounded rather than abstract. He's rated 5.0 by students.
Testimonials
Because the right Statistics tutor makes all the difference.
Average Session Rating – Based on 3.4M Learner Ratings
Practice Statistics
Free practice tests, flashcards, and AI tutoring for Statistics
Other Mesa Tutors
Related Math Tutors in Mesa
Frequently Asked Questions
Statistics requires both conceptual understanding and practical application—students often struggle with interpreting what statistical measures actually mean rather than just calculating them. Common pain points include understanding probability concepts, working with distributions, designing experiments, and translating real-world problems into statistical questions. Many students also find it challenging to move beyond memorizing formulas to seeing the patterns and connections that make statistics meaningful.
The first session focuses on understanding your current level, learning goals, and specific challenges. A tutor will assess which concepts are solid and where gaps exist—whether that's probability fundamentals, hypothesis testing, or data interpretation. This helps create a personalized plan that addresses your unique needs and aligns with your course curriculum.
Word problems require translating real-world scenarios into statistical language and identifying which methods apply—a skill that takes practice. Tutors help you develop a systematic approach: identifying what's given, what you're solving for, and which statistical tools fit. With guided practice and feedback on your reasoning, you'll build confidence in breaking down complex problems into manageable steps.
Absolutely. Math anxiety often stems from feeling lost or unsupported—personalized 1-on-1 instruction creates a judgment-free space to ask questions and work through concepts at your own pace. As you experience small wins and see patterns click into place, confidence naturally builds. Many students find that understanding the 'why' behind statistical methods reduces anxiety significantly.
Yes. Mesa's 37 school districts use various approaches to teaching Statistics, and tutors are familiar with different textbooks and curriculum frameworks. Whether your course emphasizes traditional methods, simulation-based approaches, or technology-heavy instruction, tutors can align their teaching with your specific course materials and expectations.
Showing your reasoning is essential in Statistics—it's not just about the final answer. Tutors help you develop clear, organized approaches to problems: stating hypotheses, explaining your method choice, and interpreting results in context. This builds both understanding and the communication skills needed for tests, projects, and real-world analysis.
Varsity Tutors matches you with expert tutors who specialize in Statistics and understand Mesa-area curricula. You can share your specific challenges—whether that's probability, regression, or experimental design—and we'll connect you with someone who fits your needs and learning style. The process is straightforward, and you can start with a single session to see if it's a good fit.
Many students see meaningful progress within 3-4 sessions as foundational concepts become clearer and problem-solving strategies take shape. Bigger gains—like moving from struggling to confident on exams—usually take 6-8 weeks of consistent work. The timeline depends on your starting point and how frequently you meet, but personalized instruction accelerates learning compared to classroom-only instruction.
Let’s find your perfect tutor
Answer a few quick questions. We’ll recommend the right plan and match you with a top 5% tutor.