0%
0 / 1 answered
Skewed Distributions Practice Test
•1 QuestionsQuestion
1 / 1
Q1
A social scientist performs an experiment testing the frequency and correlation of several demographics. She plots a histogram measuring income versus education level. She produces the following graph:
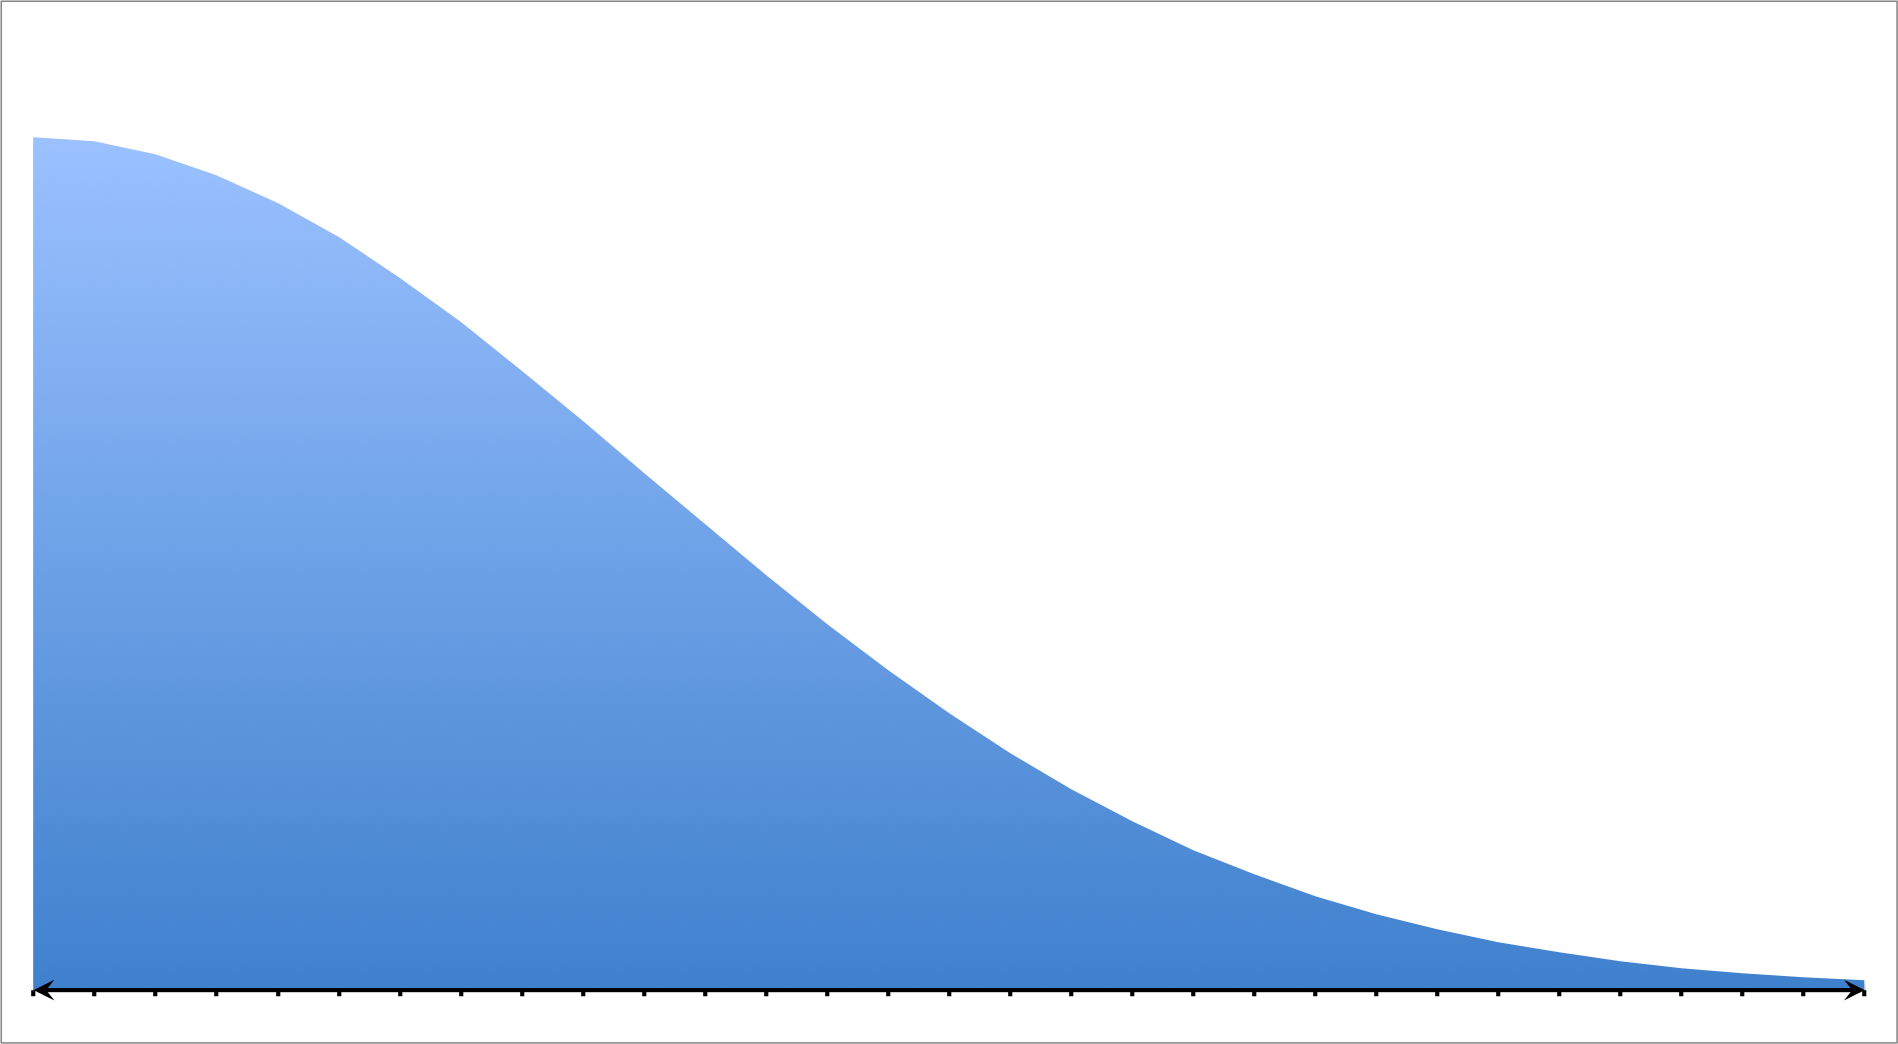
Which of the following choices best describes this model?
A social scientist performs an experiment testing the frequency and correlation of several demographics. She plots a histogram measuring income versus education level. She produces the following graph:
Which of the following choices best describes this model?