How to graph a function
Help Questions
SSAT Upper Level: Quantitative › How to graph a function
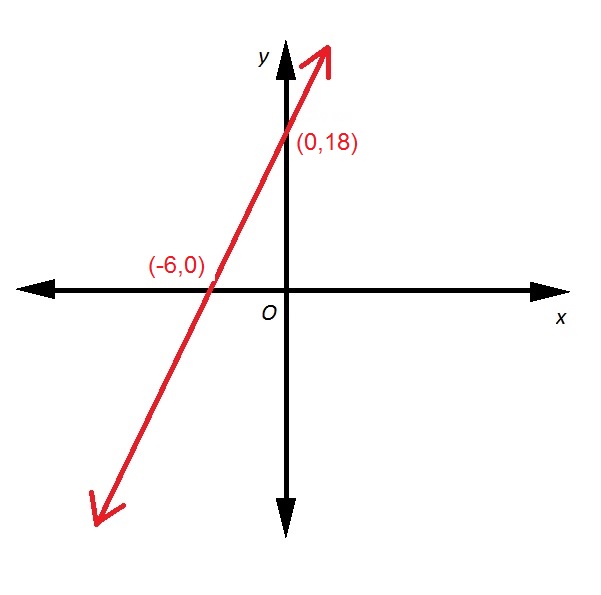
Refer to the above diagram. If the red line passes through the point ")


Explanation
One way to answer this is to first find the equation of the line.
The slope of a line. given two points , (x_{2}, y_{2})")

Set 
} = \frac{18}{6} = 3")
The line has slope 3 and 
")


Now substitute 4 for 


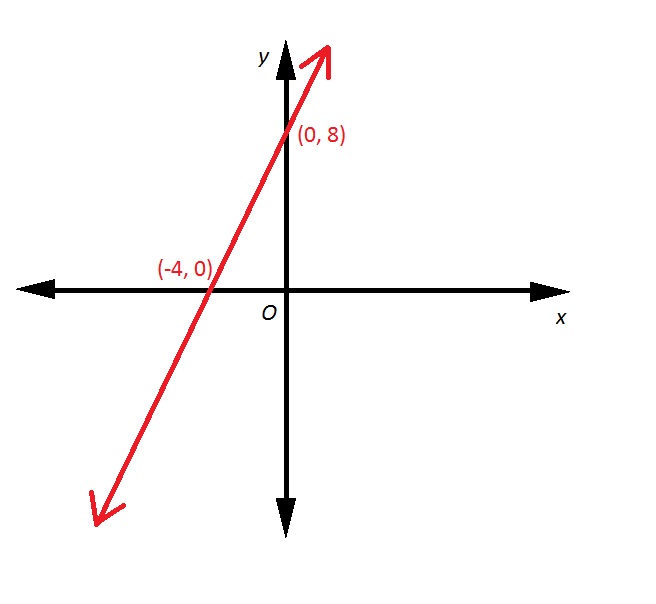
Refer to the above red line. A line is drawn perpendicular to that line, and with the same 


Explanation
First, we need to find the slope of the above line.
The slope of a line. given two points , (x_{2}, y_{2})")

Set 
} = \frac{8}{4} = 2")
The slope of a line perpendicular to it has as its slope the opposite of the reciprocal of 2, which would be 

")


