How to graph a line
Help Questions
PSAT Math › How to graph a line
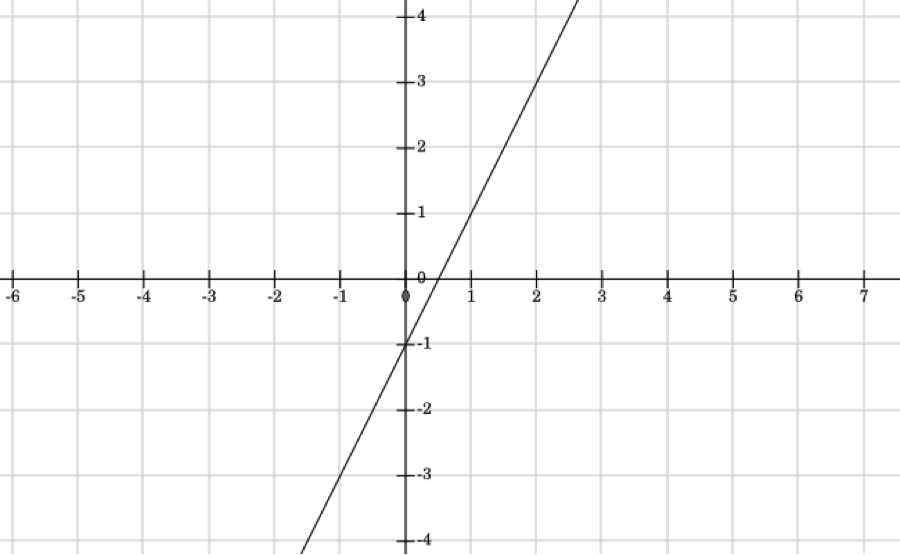
What is the equation of the line in the graph above?


Explanation
In order to find the equation of a line in slope-intercept form 


Slope is the rate of change of a line, which can be calculated by figuring out the change in y divided by the change in x, using the formula

When looking at a graph, you can pick two points on a graph and substitute their x- and y-values into that equation. On this graph, it's easier to choose points like ")
")

Plugging in those values for 


What are the x- and y- intercepts of the equation 
\textup{and}\left ( 0,-2\right )")
\ \textup{and}\ \left ( 0,\frac{1}{2}\right )")
\ \textup{and}\ \left ( 0,-2\right )")
\ \textup{and}\ \left ( 0,4\right )")
\ \textup{and}\left ( 0,-4\right )")
Explanation
Answer: (1/2,0) and (0,-2)
Finding the y-intercept: The y-intercept is the point at which the line crosses tye y-axis, meaning that x = 0 and the format of the ordered pair is (0,y) with y being the y-intercept. The equation 

Finding the x-intercept: To find the x-intercept of the equation 


The x-interecept is therefore (1/2,0).
A line graphed on the coordinate plane below. 
Give the equation of the line in slope intercept form.


Explanation
The slope of the line is 

The equation of the line is 
The equation 
I
II
III
IV
Cannot be determined
Explanation
Plug in 

 + 2y = 6")

Thus, ")
Plug in 

 = 6")

")
Now we know that the line passes through the points ")
")
A quick sketch of the two points reveals that the line passes through all but the third quadrant.
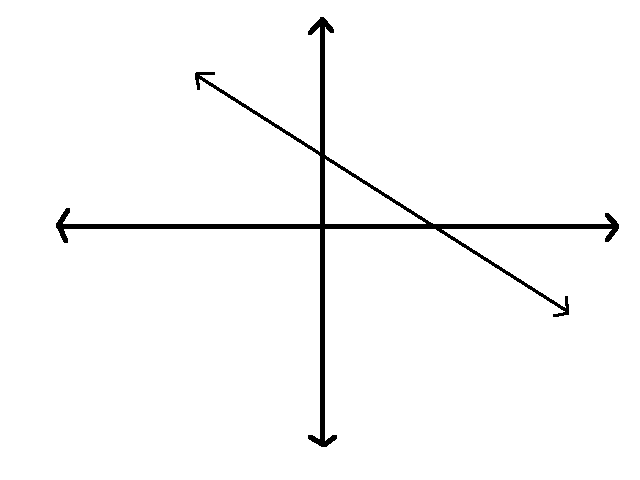
Which of the following could be the equation of the line shown in this graph?


Explanation
The line in the diagram has a negative slope and a positive y-intercept. It has a negative slope because the line moves from the upper left to the lower right, and it has a positive y-intercept because the line intercepts the y-axis above zero.
The only answer choice with a negative slope and a positive y-intercept is

Give the equation of the curve.


None of the other answers


Explanation
 This is the parent graph of
