Center, Shape, & Spread of Data
Help Questions
PSAT Math › Center, Shape, & Spread of Data
Two students tracked the number of hours they studied each week for 6 weeks. Student A: 2, 2, 3, 3, 3, 5. Student B: 1, 2, 3, 3, 4, 5. Which statement correctly compares the medians and the variability using the range? (Use range $=\max-\min$.)
Same median; A has larger range
A has larger median; same range
B has larger median; B has larger range
Same median; B has larger range
Explanation
The question asks to compare the medians and ranges (as variability) for two students' study hours over 6 weeks. For median, order each set; both have even count, so average 3rd and 4th: both A and B yield 3. For range, subtract min from max: A is 5-2=3, B is 5-1=4, so same median, B larger range. Emphasize calculating range as max - min for spread. A common error is forgetting to average for even-numbered median or misordering. Remember, range shows full spread but is outlier-sensitive. As a strategy, compute medians first then spreads to systematically compare.
A teacher computed the mean test score for a class of 5 students: 72, 75, 78, 80, 95. Another student joins the class with a score of 20. Which statement best describes how adding the score of 20 affects the mean and the median of the scores? Assume the class now has 6 students.
Mean decreases; median stays the same
Mean stays the same; median decreases
Mean decreases; median decreases
Mean increases; median decreases
Explanation
The question asks how adding a score of 20 affects the mean and median of the original 5 test scores. Original mean is (72+75+78+80+95)/5 = 400/5 = 80; new mean (400+20)/6 = 420/6 = 70, so decreases. Original median is 78 (3rd in ordered); new sorted: 20,72,75,78,80,95, median (75+78)/2 = 76.5, so decreases. Both decrease, with mean affected more by the low value. A key error is not reordering for median or miscounting positions. Remember, adding extremes pulls mean but median shifts only if position changes. As a strategy, recalculate both measures before and after to observe effects.
A bakery tracked the number of cupcakes sold each day for 6 days: 34, 40, 41, 41, 43, 58. What is the range of the data set? (Some students mistakenly compute $Q_3-Q_1$ instead of max minus min.)
17
18
24
58
Explanation
The question asks for the range of cupcakes sold over 6 days: 34, 40, 41, 41, 43, 58. To find the range, subtract the minimum value (34) from the maximum (58), giving 24. This simple calculation measures the total spread of the data. Order the data if needed, but here min and max are clear. A key error is computing IQR (Q3 - Q1) instead, which for this data would be 41.5 - 40.5 = 1, not the range. Distinguish range as max minus min for overall spread, while IQR focuses on middle 50%.
A box plot is described by the five-number summary for Dataset X: min 4, $Q_1=6$, median 9, $Q_3=12$, max 20. What is the interquartile range (IQR), and which value would be considered farthest above the center based on the maximum? Choose the option that correctly gives the IQR and identifies the farthest-above-center value.
IQR $=14$; farthest value is 4
IQR $=6$; farthest value is 20
IQR $=8$; farthest value is 20
IQR $=6$; farthest value is 12
Explanation
The question asks for the interquartile range (IQR) from the five-number summary and which value is farthest above the center based on the maximum. Calculate IQR as Q3 - Q1 = 12 - 6 = 6. The center is the median 9; max 20 is 11 above, farther than min 4 (5 below), so 20 is farthest above. Remember, IQR measures middle spread, and distance from median identifies extremes. A key error is miscalculating IQR by using min/max instead of quartiles. Another mistake might be confusing farthest above with below. As a strategy, note distances from median to confirm extremes after computing IQR.
A student recorded the number of minutes it took to finish 9 practice problems on different days. The times (in minutes) were: 7, 8, 8, 9, 9, 10, 10, 11, 30. What is the median of this data set, and which measure of center (mean or median) is more affected by the outlier 30? Choose the option that correctly answers both parts.
Median $=11$; median is more affected
Median $=10$; mean is more affected
Median $=9$; mean is more affected
Median $=9$; median is more affected
Explanation
The question asks for the median of the given data set and which measure of center, the mean or the median, is more affected by the outlier 30. To find the median, first order the data: 7, 8, 8, 9, 9, 10, 10, 11, 30; with 9 values, the median is the 5th value, which is 9. The mean is calculated as the sum of all values divided by the count, so the outlier 30 significantly increases the sum and pulls the mean higher. In contrast, the median relies only on the middle value in the ordered list, so changing the outlier does not affect it as long as the middle position remains the same. A common error is forgetting to sort the data or miscounting the middle position for an odd number of values. Another mistake might be thinking the mean is unaffected by extremes, but remember that the mean is sensitive to outliers while the median is more robust. As a test-taking strategy, always verify the sorted order and recall that medians are better for skewed data with outliers.
A cross-country team recorded the number of minutes each runner took to finish a short course: 18, 19, 19, 20, 21, 22, 60. The coach wants a single measure of center that best represents a “typical” finishing time for the group. Which statement is true about the mean and median of this data set, and which measure is less affected by the outlier 60?
Mean $=$ median, and both are equally affected
Mean $>$ median, and the median is less affected
Mean $<$ median, and the median is less affected
Mean $<$ median, and the mean is less affected
Explanation
The question asks for the relationship between the mean and median of the runners' finishing times and which measure is less affected by the outlier 60 to best represent a typical time. To calculate the median, order the data: 18, 19, 19, 20, 21, 22, 60; with 7 values, the median is the 4th value, which is 20. For the mean, sum the values: 18 + 19 + 19 + 20 + 21 + 22 + 60 = 179, then divide by 7 to get approximately 25.57, showing the mean is greater than the median. The outlier 60 significantly increases the mean but has little effect on the median, making the median less affected and better for representing typical times in skewed data. A common error is miscalculating the sum or forgetting to order the data for the median. Understanding that the mean is sensitive to extreme values while the median is resistant helps in choosing the appropriate measure of center.
The data set shows quiz scores (out of 10) for 8 students: 6, 7, 7, 8, 8, 9, 9, 10. What is the interquartile range (IQR) of the scores? Use the median-of-halves method: $Q_1$ is the median of the lower half and $Q_3$ is the median of the upper half.
1
2
3
4
Explanation
This question asks for the interquartile range (IQR) of quiz scores using the median-of-halves method. First, the data is already ordered: 6, 7, 7, 8, 8, 9, 9, 10. With 8 values, split into lower half (6, 7, 7, 8) and upper half (8, 9, 9, 10). Q1 is the median of the lower half: (7+7)÷2 = 7. Q3 is the median of the upper half: (9+9)÷2 = 9. Therefore, IQR = Q3 - Q1 = 9 - 7 = 2. The IQR measures the spread of the middle 50% of data and is resistant to outliers. When using the median-of-halves method with an even number of data points, include the median values in both halves if needed.
A box plot (five-number summary) represents the distribution of times (in minutes) to complete a puzzle for a group of students: minimum 5, $Q_1=8$, median 10, $Q_3=14$, maximum 30. What is the interquartile range (IQR), and what is the range?
IQR 9; range 25
IQR 6; range 22
IQR 6; range 25
IQR 9; range 22
Explanation
The question asks for the interquartile range (IQR) and range from a box plot with minimum 5, Q1=8, median 10, Q3=14, maximum 30. The IQR is Q3 minus Q1, so 14 - 8 = 6, representing the spread of the middle 50% of times. The range is maximum minus minimum, or 30 - 5 = 25, showing the full spread including outliers. These measures highlight different aspects: IQR resists extremes, while range includes them. A key error is subtracting median instead of Q1 from Q3 for IQR. When reading box plots, note that IQR focuses on central spread, making it useful for comparing distributions; verify by direct subtraction.
A coach records the points scored by a player in 7 games: 8, 9, 9, 10, 10, 11, 13. The player then has one additional game scoring 40 points. Which statement is true about how adding 40 affects the mean and median of the data set?
Mean stays the same; median increases
Mean increases; median stays the same
Mean decreases; median stays the same
Both mean and median increase by the same amount
Explanation
The question asks how adding a score of 40 affects the mean and median of points scored in 7 games: 8, 9, 9, 10, 10, 11, 13. The original mean is the sum (70) divided by 7, equaling 10; after adding 40, the new sum is 110 divided by 8, or 13.75, so the mean increases. The original median is the 4th value in the ordered list, which is 10; with 8 values now (8, 9, 9, 10, 10, 11, 13, 40), the median is the average of the 4th and 5th (both 10), staying the same at 10. This shows the mean is sensitive to high outliers, while the median resists them. A key error is assuming the median shifts with the added value without reordering and recounting positions. When adding data points, recalculate both measures carefully to observe differential impacts on center.
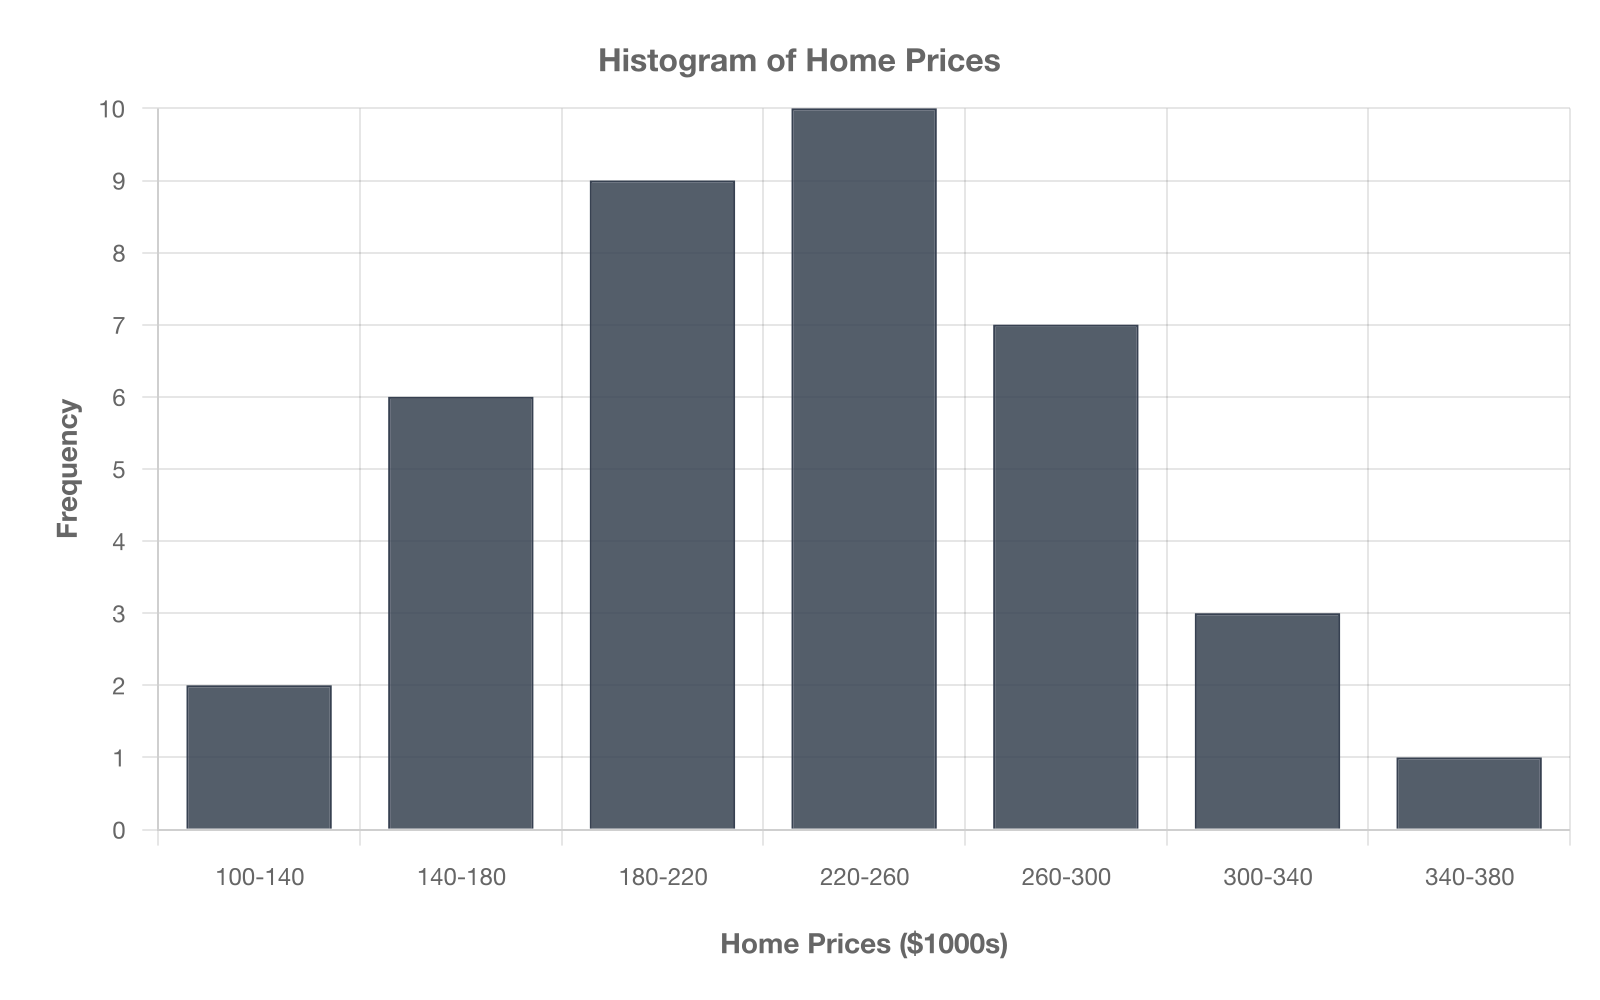
Based on the histogram shown, which measure is the best choice to describe the center of the data?
Median, because the distribution is strongly skewed.
Mode, because there is a clear single peak.
Mean, because the distribution is roughly symmetric.
Range, because it uses all data values.
Explanation
The bars form a long right tail, indicating right skew. Skew affects the mean more than the median, so the median is preferred (choice B). Choice A misidentifies the shape; choice C notes the peak but mode alone ignores most data; choice D is a measure of spread, not center.