Statistical Patterns and Random Phenomena
Help Questions
AP Statistics › Statistical Patterns and Random Phenomena
Which of the following is a discrete random variable?
The number of times heads comes up on 10 coin flips
The amount of water that passes through a dam in a random hour
The rate of return on a random stock investment
The length of a random caterpillar
Explanation
A discrete variable is a variable which can only take a countable number of values. For example, the number of times that a coin can come up heads in ten flips can only be 0, 1, 2, 3, 4, 5, 6, 7, 8, 9, or 10. Thus, there are a countable number of possible outcomes (in this case 11). This is true for coin flips, but not for caterpillar length, water flow, or rates of return for stocks.
Assume there is an election involving three parties: D, R, and I. The probability of D winning is .11, R winning is .78, and I winning is .11. What is the probability of D or R winning?
.89
.78
1
0
Explanation
Since all of the events are mutually exclusive (one of the parties must win), you can get the probability of either D or R winning by adding their probabilities.
Since the probability of D winning is .11 and R winning is .78, the probability of D or R winning is .89.
Students collected 150 cans for a food drive. There were 23 cans of corn, 48 cans of beans, and 12 cans of tomato sauce. If a student randomly selects one can to give away, what is the probability that the can will be either tomato sauce or beans?


Explanation
In this case, we want to know the probability of multiple, mutually exclusive possible outcomes. The possible outcomes are mutually exclusive because one can of food could not be both beans and tomato sauce. To determine the probability of the two possible outcomes, add them together and then find the least common denominator.

When rolling a 6 sided dice, what is the probability of rolling a 2 or a 4?


Explanation
In the single roll of a dice, rolling a 2 is mutually exclusive of rolling a 4. When a question asks for the probability of event A "or" event B, the probability is the sum of each event.
= P(A)+P(B)")
First, find the probability of each individual event.
=1/6")
=1/6")
Because the problem asks for a 2 OR a 4, add the indivual probabilities together.
=1/6+1/6= 2/6= 0.33")
Let us suppose we have population data where the data are distributed Poisson
(see the figure for an example of a Poisson random variable). 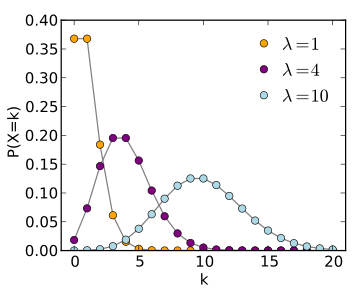
Which distribution increasingly approximates the sample mean as the sample size increases to infinity?
Normal
Poisson
Exponential
Gamma
Explanation
The Central Limit Theorem holds that for any distribution with finite mean and variance the sample mean will converge in distribution to the normal as sample size 

If the Central Limit Theorem applies, we can infer that:
The sampling distribution will be approximately normally distributed.
The standard deviation will be small.
The sample mean will be close to the population mean.
Every possible sample mean will be equal to the population mean.
Explanation
The Central Limit Theorem tells us that when the theorem applies, the sampling distribution will be approximately normally distributed.
Cat owners spend an average of $40 per month on their pets, with a standard deviation of $5.
What is the probability that a randomly selected pet owner spends less than 


Explanation
First, draw the distribution and the area you are interested in.
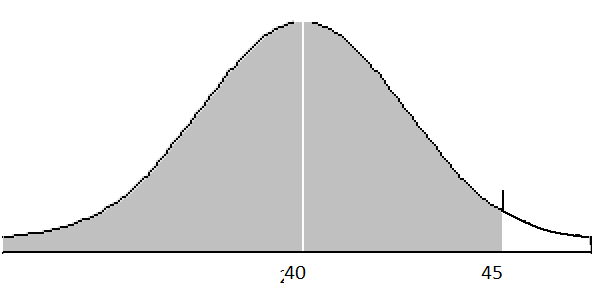
Next, calculate the z-score for the person of interest. Because the population standard deviation is known, we will use the formula for z-score and not t-score.
We will find the z-score for the person of interest, and then calculate the area under the curve that falls below, or to the left of that z-score.

Now we will find the value for each variable given in the problem:


Third, solve for z using the information in the problem.


Now we must determine the area under the curve to the left of a z-score of 1.0. We will consult a z-table.
Look up 1.0 in the row and 0.00 in the column.
If your z-table gives shaded area to the left, you will get
=0.8413")
We are interested in area to the left, which is what we found, so this is our answer.
If your z-table gives shaded area to the right, you will get
=0.1587")
Because we want the area to the left of z=1.0, we will subtract that area from 1:

In a particular library, there is a sign in the elevator that indicates a limit of 


If a random sample of 


None of the other answers
Explanation
This question deals with the Central Limit Theorem, which states that a random sample taken from a large population where the sampling distribution of sample averages is approximately normal has a standard deviation equal to the standard deviation of the population divided by the square root of the sample size. The information given allows us to apply the Central Limit Theorem as it satisfies the necessary characteristics of the sampling distribution/size. The standard deviation of the population is 27lbs, and the sample size is 36; therefore, the standard deviation of the 36-person random sample is 
Let us suppose we have population data where the data are distributed Poisson
(see the figure for an example of a Poisson random variable).
Which distribution increasingly approximates the sample mean as the sample size increases to infinity?
Normal
Poisson
Exponential
Gamma
Explanation
The Central Limit Theorem holds that for any distribution with finite mean and variance the sample mean will converge in distribution to the normal as sample size
In a particular library, there is a sign in the elevator that indicates a limit of
If a random sample of
None of the other answers
Explanation
This question deals with the Central Limit Theorem, which states that a random sample taken from a large population where the sampling distribution of sample averages is approximately normal has a standard deviation equal to the standard deviation of the population divided by the square root of the sample size. The information given allows us to apply the Central Limit Theorem as it satisfies the necessary characteristics of the sampling distribution/size. The standard deviation of the population is 27lbs, and the sample size is 36; therefore, the standard deviation of the 36-person random sample is