Comparing Functions Represented in Different Ways
Help Questions
Algebra 2 › Comparing Functions Represented in Different Ways
Function $f$ is described verbally as: “An exponential function with initial value $5$ and growth factor $1.5$.” Function $g$ is given algebraically by $g(x)=4\cdot 2^x$.
Which function has the larger $y$-intercept?
Function $g$ has the larger $y$-intercept ($8$ vs $5$).
They have equal $y$-intercepts (both $5$).
Function $f$ has the larger $y$-intercept ($5$ vs $4$).
Function $g$ has the larger $y$-intercept ($4$ vs $5$).
Explanation
This question tests your ability to compare function properties when functions are presented in different ways—like one given as a formula and another as a graph—requiring you to extract the same feature from each representation and compare them. Functions can be represented in four main ways, and each representation makes certain features easy to see: formulas let you calculate any value precisely and see structure (like y = mx + b shows slope m immediately), graphs show shape and extrema visually (you can spot maximums and end behavior at a glance), tables provide exact input-output pairs (easy to read specific values), and verbal descriptions summarize key features in words. To compare functions in different representations, extract the desired property from each using the method that fits that representation, then compare the extracted values! For function f described verbally as exponential with initial value 5 (which is the y-intercept), it's directly given; for function g given by g(x) = 4 · $2^x$, set x=0 to get 4 · 1 = 4, so comparing shows f's 5 is larger than g's 4. Choice A correctly extracts the y-intercept from both and compares accurately, showing function f has the larger y-intercept. A distractor like choice B might result from miscalculating g(0) as 8 (perhaps thinking 4·2 instead of $4·2^0$=4)—always plug in x=0 carefully for the initial value. Property extraction by representation type: FROM FORMULA—y-intercept: set x = 0; maximum of quadratic: complete square or use vertex formula; slope: read from y = mx + b or calculate rise/run. FROM GRAPH—intercepts: see where crosses axes; maximum: find highest point and read coordinates; slope: pick two points, calculate rise/run. FROM TABLE—intercept: find row where x = 0 or y = 0; maximum: scan for largest y-value; slope (linear): calculate Δy/Δx between any two points. Use the method matching your representation! Quick comparison shortcuts: for y-intercepts, formulas are fastest (plug in x = 0), but graphs let you just read off where it crosses the y-axis. For maxima, graphs are easiest (visually find highest point), but formulas of quadratics give exact vertex. For growth rates, tables let you calculate differences (linear) or ratios (exponential) directly. Play to each representation's strengths—don't convert everything to formulas if the feature is obvious in the given form! Efficient comparison means using the representation smartly.
Function $f$ is linear and given by $f(x) = -4x + 7$. Function $g$ is represented by the table.
\begin{center}
\begin{tabular}{c|c}
$x$ & $g(x)$ \\hline
$0$ & $2$ \
$1$ & $5$ \
$2$ & $8$ \
$3$ & $11$ \
\end{tabular}
\end{center}
Which function has the greater slope (rate of change)?
Cannot be determined from the information given.
Function $f$
They have equal slopes.
Function $g$
Explanation
This question tests your ability to compare function properties when functions are presented in different ways—like one given as a formula and another as a graph—requiring you to extract the same feature from each representation and compare them. Functions can be represented in four main ways, and each representation makes certain features easy to see: formulas let you calculate any value precisely and see structure (like y = mx + b shows slope m immediately), graphs show shape and extrema visually (you can spot maximums and end behavior at a glance), tables provide exact input-output pairs (easy to read specific values), and verbal descriptions summarize key features in words. To compare functions in different representations, extract the desired property from each using the method that fits that representation, then compare the extracted values! For function f given by f(x) = -4x + 7, the slope is immediately visible as the coefficient of x, which is -4. For function g given in the table, we calculate the slope using any two points: taking (0,2) and (1,5), slope = (5-2)/(1-0) = 3/1 = 3, or using (1,5) and (2,8), slope = (8-5)/(2-1) = 3/1 = 3. Choice B correctly identifies that g has the greater slope since 3 > -4 (remember that positive slopes are greater than negative slopes). A common error would be to compare absolute values and think |-4| > 3, but when comparing slopes, we must consider the sign—positive slopes indicate increasing functions while negative slopes indicate decreasing functions. Property extraction by representation type: FROM FORMULA—y-intercept: set x = 0; maximum of quadratic: complete square or use vertex formula; slope: read from y = mx + b or calculate rise/run. FROM GRAPH—intercepts: see where crosses axes; maximum: find highest point and read coordinates; slope: pick two points, calculate rise/run. FROM TABLE—intercept: find row where x = 0 or y = 0; maximum: scan for largest y-value; slope (linear): calculate Δy/Δx between any two points. Use the method matching your representation! Quick comparison shortcuts: for y-intercepts, formulas are fastest (plug in x = 0), but graphs let you just read off where it crosses the y-axis. For maxima, graphs are easiest (visually find highest point), but formulas of quadratics give exact vertex. For growth rates, tables let you calculate differences (linear) or ratios (exponential) directly. Play to each representation's strengths—don't convert everything to formulas if the feature is obvious in the given form! Efficient comparison means using the representation smartly.
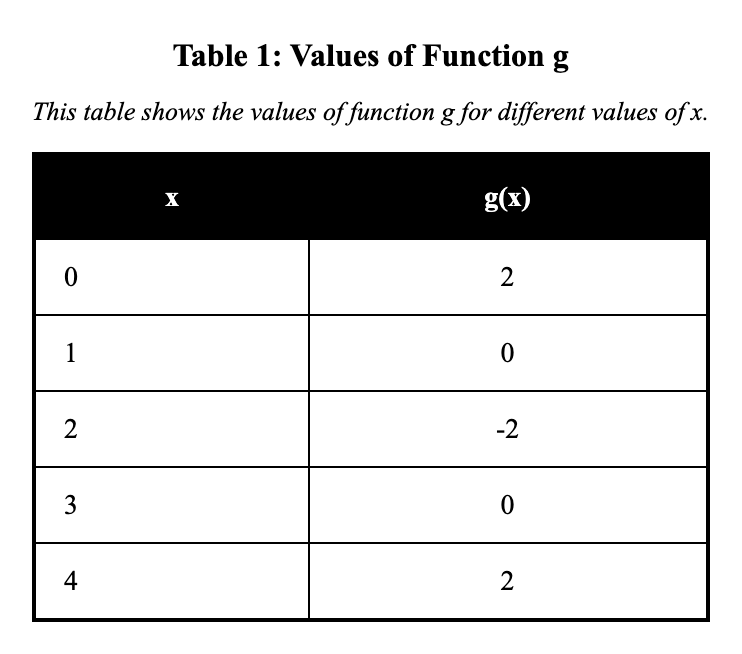
Function $f$ is given by $f(x)=x^2-6x+5$. Function $g$ is shown in the table:
$\begin{array}{c|ccccc}
x & 0 & 1 & 2 & 3 & 4\ \hline
g(x) & 2 & 0 & -2 & 0 & 2
\end{array}$
Which statement correctly compares the minimum values of $f$ and $g$?
They have the same minimum value ($-2$).
$g$ has a smaller minimum value than $f$ ($-2$ vs $-1$).
$f$ has a smaller minimum value than $g$ ($-4$ vs $-2$).
$f$ has a larger minimum value than $g$ ($-4$ vs $-2$).
Explanation
This question tests your ability to compare function properties when functions are presented in different ways—like one given as a formula and another as a table—requiring you to extract the same feature from each representation and compare them.
Functions can be represented in four main ways, and each representation makes certain features easy to see: formulas let you calculate any value precisely and see structure (like y = mx + b shows slope m immediately), graphs show shape and extrema visually (you can spot maximums and end behavior at a glance), tables provide exact input-output pairs (easy to read specific values), and verbal descriptions summarize key features in words. To compare functions in different representations, extract the desired property from each using the method that fits that representation, then compare the extracted values!
For function f, given as f(x) = $x^2$ - 6x + 5, find minimum by vertex formula x = -b/(2a) = 6/2 = 3, then f(3) = 9 - 18 + 5 = -4. For function g, scan table values (2, 0, -2, 0, 2) to find smallest is -2.
Choice A correctly extracts the minimum from both (-4 for f from vertex calculation, -2 for g from scanning table) and compares accurately, showing f has the smaller minimum value.
A common distractor like choice D might misinterpret 'larger minimum' by confusing inequality, but since -4 < -2, f's is smaller; focus on the numerical comparison.
Property extraction by representation type: FROM FORMULA—y-intercept: set x = 0; maximum of quadratic: complete square or use vertex formula; slope: read from y = mx + b or calculate rise/run. FROM GRAPH—intercepts: see where crosses axes; maximum: find highest point and read coordinates; slope: pick two points, calculate rise/run. FROM TABLE—intercept: find row where x = 0 or y = 0; maximum: scan for largest y-value; slope (linear): calculate Δy/Δx between any two points. Use the method matching your representation!
Quick comparison shortcuts: for y-intercepts, formulas are fastest (plug in x = 0), but graphs let you just read off where it crosses the y-axis. For maxima, graphs are easiest (visually find highest point), but formulas of quadratics give exact vertex. For growth rates, tables let you calculate differences (linear) or ratios (exponential) directly. Play to each representation's strengths—don't convert everything to formulas if the feature is obvious in the given form! Efficient comparison means using the representation smartly.
Function $f$ is shown on the coordinate plane as a line passing through the points $(-2,-1)$ and $(2,7)$. Function $g$ is given algebraically by $g(x)=3x+1$. Which function has the greater rate of change (slope)?
Function $f$ has the greater slope (2 vs. 3).
Function $f$ has the greater slope (8 vs. 3).
They have equal slopes (both 2).
Function $g$ has the greater slope (3 vs. 2).
Explanation
This question tests your ability to compare function properties when functions are presented in different ways—like one given graphically via points and another as a formula—requiring you to extract the same feature from each representation and compare them.
Functions can be represented in four main ways, and each representation makes certain features easy to see: formulas let you calculate any value precisely and see structure (like y = mx + b shows slope m immediately), graphs show shape and extrema visually (you can spot maximums and end behavior at a glance), tables provide exact input-output pairs (easy to read specific values), and verbal descriptions summarize key features in words. To compare functions in different representations, extract the desired property from each using the method that fits that representation, then compare the extracted values!
For function f shown as a line through (-2,-1) and (2,7), calculate slope as (7 - (-1))/(2 - (-2)) = 8/4 = 2; for function g given by g(x) = 3x + 1, the slope is the coefficient of x, which is 3, so comparing 3 > 2 shows g has the greater slope.
Choice B correctly extracts the slope from both and compares accurately, showing g has the greater slope (3 vs. 2).
A distractor like choice A might result from reversing the comparison after calculation, incorrectly claiming f has the greater slope (2 vs. 3), but ensure you identify which value is actually larger.
Property extraction by representation type: FROM FORMULA—y-intercept: set x = 0; maximum of quadratic: complete square or use vertex formula; slope: read from y = mx + b or calculate rise/run. FROM GRAPH—intercepts: see where crosses axes; maximum: find highest point and read coordinates; slope: pick two points, calculate rise/run. FROM TABLE—intercept: find row where x = 0 or y = 0; maximum: scan for largest y-value; slope (linear): calculate Δy/Δx between any two points. Use the method matching your representation!
Quick comparison shortcuts: for y-intercepts, formulas are fastest (plug in x = 0), but graphs let you just read off where it crosses the y-axis. For maxima, graphs are easiest (visually find highest point), but formulas of quadratics give exact vertex. For growth rates, tables let you calculate differences (linear) or ratios (exponential) directly. Play to each representation's strengths—don't convert everything to formulas if the feature is obvious in the given form! Efficient comparison means using the representation smartly.
Function $f$ is given by $f(x)=\left(\frac{1}{3}\right)^x$. Function $g$ is described verbally as: “An exponential function that starts at $g(0)=2$ and triples each time $x$ increases by 1." Which function has the larger output at $x=2$?
They are equal at $x=2$.
Not enough information to compare $f(2)$ and $g(2)$.
Function $f$
Function $g$
Explanation
This question tests your ability to compare function properties when functions are presented in different ways—like one given as a formula and another as a graph—requiring you to extract the same feature from each representation and compare them. Functions can be represented in four main ways, and each representation makes certain features easy to see: formulas let you calculate any value precisely and see structure (like y = mx + b shows slope m immediately), graphs show shape and extrema visually (you can spot maximums and end behavior at a glance), tables provide exact input-output pairs (easy to read specific values), and verbal descriptions summarize key features in words. To compare functions in different representations, extract the desired property from each using the method that fits that representation, then compare the extracted values! For function f given by f(x) = $(1/3)^x$, we calculate f(2) = (1/3)² = 1/9 ≈ 0.111. For function g described as starting at g(0) = 2 and tripling each time x increases by 1, we have g(1) = 2×3 = 6 and g(2) = 6×3 = 18. Choice B correctly identifies that g has the larger output at x = 2 since 18 > 1/9. A common error would be to misinterpret "triples" as multiplying by 1/3 instead of by 3, or to confuse the growth pattern of g with that of f, but g grows by a factor of 3 while f decays by a factor of 1/3. Property extraction by representation type: FROM FORMULA—y-intercept: set x = 0; maximum of quadratic: complete square or use vertex formula; slope: read from y = mx + b or calculate rise/run. FROM GRAPH—intercepts: see where crosses axes; maximum: find highest point and read coordinates; slope: pick two points, calculate rise/run. FROM TABLE—intercept: find row where x = 0 or y = 0; maximum: scan for largest y-value; slope (linear): calculate Δy/Δx between any two points. Use the method matching your representation! Quick comparison shortcuts: for y-intercepts, formulas are fastest (plug in x = 0), but graphs let you just read off where it crosses the y-axis. For maxima, graphs are easiest (visually find highest point), but formulas of quadratics give exact vertex. For growth rates, tables let you calculate differences (linear) or ratios (exponential) directly. Play to each representation's strengths—don't convert everything to formulas if the feature is obvious in the given form! Efficient comparison means using the representation smartly.
Function $f$ is given by $f(x)=\dfrac{x+2}{x-1}$. Function $g$ is described verbally as: “A rational function with a vertical asymptote at $x=-4$." Which function has the vertical asymptote farther from the origin (i.e., larger $|x|$ value)?
They are equally far from the origin.
Function $f$ (its vertical asymptote is farther).
Function $g$ (its vertical asymptote is farther).
Neither function has a vertical asymptote.
Explanation
This question tests your ability to compare function properties when functions are presented in different ways—like one given as a formula and another as a graph—requiring you to extract the same feature from each representation and compare them. Functions can be represented in four main ways, and each representation makes certain features easy to see: formulas let you calculate any value precisely and see structure (like y = mx + b shows slope m immediately), graphs show shape and extrema visually (you can spot maximums and end behavior at a glance), tables provide exact input-output pairs (easy to read specific values), and verbal descriptions summarize key features in words. To compare functions in different representations, extract the desired property from each using the method that fits that representation, then compare the extracted values! For function f given by f(x) = (x+2)/(x-1), the vertical asymptote occurs where the denominator equals zero: x - 1 = 0, so x = 1, which is distance |1| = 1 from the origin. Function g is described as having a vertical asymptote at x = -4, which is distance |-4| = 4 from the origin. Choice B correctly identifies that g has the vertical asymptote farther from the origin since 4 > 1. A common mistake would be to compare -4 and 1 directly without taking absolute values, but distance from the origin is always measured as the absolute value of the coordinate. Property extraction by representation type: FROM FORMULA—y-intercept: set x = 0; maximum of quadratic: complete square or use vertex formula; slope: read from y = mx + b or calculate rise/run. FROM GRAPH—intercepts: see where crosses axes; maximum: find highest point and read coordinates; slope: pick two points, calculate rise/run. FROM TABLE—intercept: find row where x = 0 or y = 0; maximum: scan for largest y-value; slope (linear): calculate Δy/Δx between any two points. Use the method matching your representation! Quick comparison shortcuts: for y-intercepts, formulas are fastest (plug in x = 0), but graphs let you just read off where it crosses the y-axis. For maxima, graphs are easiest (visually find highest point), but formulas of quadratics give exact vertex. For growth rates, tables let you calculate differences (linear) or ratios (exponential) directly. Play to each representation's strengths—don't convert everything to formulas if the feature is obvious in the given form! Efficient comparison means using the representation smartly.
Function $f$ is given by $f(x)=(x-2)^2-9$. Function $g$ is shown on the coordinate plane as a parabola with vertex at $(0,-4)$ opening upward. Which function has the smaller minimum value?
Function $f$ has the smaller minimum value ($-9$ vs. $-4$).
Function $g$ has the smaller minimum value ($-4$ vs. $-9$).
They have the same minimum value (both $-4$).
Function $g$ has the smaller minimum value ($-4$ vs. $9$).
Explanation
This question tests your ability to compare function properties when functions are presented in different ways—like one given as a formula and another graphically—requiring you to extract the same feature from each representation and compare them.
Functions can be represented in four main ways, and each representation makes certain features easy to see: formulas let you calculate any value precisely and see structure (like y = mx + b shows slope m immediately), graphs show shape and extrema visually (you can spot maximums and end behavior at a glance), tables provide exact input-output pairs (easy to read specific values), and verbal descriptions summarize key features in words. To compare functions in different representations, extract the desired property from each using the method that fits that representation, then compare the extracted values!
For function f given by f(x) = $(x-2)^2$ - 9, the minimum occurs at x=2 (vertex), with f(2) = -9; for function g shown as an upward-opening parabola with vertex (0,-4), the minimum is the y-coordinate -4, so comparing -9 < -4 shows f has the smaller minimum.
Choice A correctly extracts the minimum from both and compares accurately, showing f has the smaller minimum value (-9 vs. -4).
A distractor like choice C could result from mixing up which is smaller, incorrectly claiming g has the smaller minimum (-4 vs. -9), but recall that more negative means smaller.
Property extraction by representation type: FROM FORMULA—y-intercept: set x = 0; maximum of quadratic: complete square or use vertex formula; slope: read from y = mx + b or calculate rise/run. FROM GRAPH—intercepts: see where crosses axes; maximum: find highest point and read coordinates; slope: pick two points, calculate rise/run. FROM TABLE—intercept: find row where x = 0 or y = 0; maximum: scan for largest y-value; slope (linear): calculate Δy/Δx between any two points. Use the method matching your representation!
Quick comparison shortcuts: for y-intercepts, formulas are fastest (plug in x = 0), but graphs let you just read off where it crosses the y-axis. For maxima, graphs are easiest (visually find highest point), but formulas of quadratics give exact vertex. For growth rates, tables let you calculate differences (linear) or ratios (exponential) directly. Play to each representation's strengths—don't convert everything to formulas if the feature is obvious in the given form! Efficient comparison means using the representation smartly.
Function $f$ is given by the equation $f(x)=4\cdot 3^x$. Function $g$ is described verbally as: “An exponential function with initial value $g(0)=6$ and growth factor $2$ (so each time $x$ increases by 1, the output is multiplied by 2).”
Which function has the faster growth rate?
Function $f$, because its growth factor is $3$ compared to $2$.
They have the same growth rate.
Function $g$, because its initial value is larger.
Function $g$, because its growth factor is $2$ compared to $3$.
Explanation
This question tests your ability to compare function properties when functions are presented in different ways—like one given as a formula and another as a verbal description—requiring you to extract the same feature from each representation and compare them.
Functions can be represented in four main ways, and each representation makes certain features easy to see: formulas let you calculate any value precisely and see structure (like y = mx + b shows slope m immediately), graphs show shape and extrema visually (you can spot maximums and end behavior at a glance), tables provide exact input-output pairs (easy to read specific values), and verbal descriptions summarize key features in words. To compare functions in different representations, extract the desired property from each using the method that fits that representation, then compare the extracted values!
For function f, given as f(x) = 4 * $3^x$, the growth factor is 3 (multiplier per unit x increase). For function g, verbal description states growth factor 2, so f's 3 > 2 means faster growth.
Choice B correctly extracts the growth factors (3 for f from exponential base, 2 for g from description) and compares accurately, showing f has the faster growth rate.
A common distractor like choice C might reverse the comparison, but since 3 > 2, f grows faster; initial values don't affect the rate itself.
Property extraction by representation type: FROM FORMULA—y-intercept: set x = 0; maximum of quadratic: complete square or use vertex formula; slope: read from y = mx + b or calculate rise/run. FROM GRAPH—intercepts: see where crosses axes; maximum: find highest point and read coordinates; slope: pick two points, calculate rise/run. FROM TABLE—intercept: find row where x = 0 or y = 0; maximum: scan for largest y-value; slope (linear): calculate Δy/Δx between any two points. Use the method matching your representation!
Quick comparison shortcuts: for y-intercepts, formulas are fastest (plug in x = 0), but graphs let you just read off where it crosses the y-axis. For maxima, graphs are easiest (visually find highest point), but formulas of quadratics give exact vertex. For growth rates, tables let you calculate differences (linear) or ratios (exponential) directly. Play to each representation's strengths—don't convert everything to formulas if the feature is obvious in the given form! Efficient comparison means using the representation smartly.
Function $f$ is given by $f(x)=\left(\dfrac{1}{2}\right)^x$. Function $g$ is represented by the table:
$\begin{array}{c|cccc}
x & 0 & 1 & 2 & 3\ \hline
g(x) & 5 & 10 & 20 & 40
\end{array}$
Which function has the greater output at $x=3$?
Not enough information to compare at $x=3$.
Function $f$, because $f(3)=\dfrac{1}{8}$ is greater than $40$.
Function $g$, because $g(3)=40$ is greater than $f(3)=\dfrac{1}{8}$.
They are equal at $x=3$.
Explanation
This question tests your ability to compare function properties when functions are presented in different ways—like one given as a formula and another as a table—requiring you to extract the same feature from each representation and compare them.
Functions can be represented in four main ways, and each representation makes certain features easy to see: formulas let you calculate any value precisely and see structure (like y = mx + b shows slope m immediately), graphs show shape and extrema visually (you can spot maximums and end behavior at a glance), tables provide exact input-output pairs (easy to read specific values), and verbal descriptions summarize key features in words. To compare functions in different representations, extract the desired property from each using the method that fits that representation, then compare the extracted values!
For function f, given as f(x) = $(1/2)^x$, calculate f(3) = $(1/2)^3$ = 1/8. For function g, read from table g(3) = 40 directly.
Choice B correctly extracts the output at x=3 from both (1/8 for f by exponentiation, 40 for g from table) and compares accurately, showing g has the greater output.
A common distractor like choice A might swap the values or miscalculate $(1/2)^3$ as something larger, but remember it's 1/8, and 40 > 1/8 is clear.
Property extraction by representation type: FROM FORMULA—y-intercept: set x = 0; maximum of quadratic: complete square or use vertex formula; slope: read from y = mx + b or calculate rise/run. FROM GRAPH—intercepts: see where crosses axes; maximum: find highest point and read coordinates; slope: pick two points, calculate rise/run. FROM TABLE—intercept: find row where x = 0 or y = 0; maximum: scan for largest y-value; slope (linear): calculate Δy/Δx between any two points. Use the method matching your representation!
Quick comparison shortcuts: for y-intercepts, formulas are fastest (plug in x = 0), but graphs let you just read off where it crosses the y-axis. For maxima, graphs are easiest (visually find highest point), but formulas of quadratics give exact vertex. For growth rates, tables let you calculate differences (linear) or ratios (exponential) directly. Play to each representation's strengths—don't convert everything to formulas if the feature is obvious in the given form! Efficient comparison means using the representation smartly.
Function $f$ is given by $f(x)=\dfrac{x+4}{x-1}$. Function $g$ is described verbally as: “$g$ is a rational function with a vertical asymptote at $x=-3$.” Which function has a vertical asymptote farther from the origin (i.e., with larger $|x|$)?
They are equally far from the origin (both at distance 3).
Function $g$ (at $x=-3$) is farther from the origin than function $f$ (at $x=1$).
They are equally far from the origin (both at distance 1).
Function $f$ (at $x=1$) is farther from the origin than function $g$ (at $x=-3$).
Explanation
This question tests your ability to compare function properties when functions are presented in different ways—like one given as a formula and another verbally—requiring you to extract the same feature from each representation and compare them. Functions can be represented in four main ways, and each representation makes certain features easy to see: formulas let you calculate any value precisely and see structure (like y = mx + b shows slope m immediately), graphs show shape and extrema visually (you can spot maximums and end behavior at a glance), tables provide exact input-output pairs (easy to read specific values), and verbal descriptions summarize key features in words. To compare functions in different representations, extract the desired property from each using the method that fits that representation, then compare the extracted values! For function f given by f(x) = (x+4)/(x-1), the vertical asymptote is where the denominator is zero, at x=1, so |x|=1; for function g described verbally as having a vertical asymptote at x=-3, |x|=3, so comparing 3 > 1 shows g's asymptote is farther from the origin. Choice B correctly extracts the asymptote positions from both and compares accurately, showing g (at x=-3) is farther from the origin than f (at x=1). A distractor like choice A might stem from forgetting to take absolute values or miscomparing distances, incorrectly stating f is farther, but always compute |x| for distance from origin. Property extraction by representation type: FROM FORMULA—y-intercept: set x = 0; maximum of quadratic: complete square or use vertex formula; slope: read from y = mx + b or calculate rise/run. FROM GRAPH—intercepts: see where crosses axes; maximum: find highest point and read coordinates; slope: pick two points, calculate rise/run. FROM TABLE—intercept: find row where x = 0 or y = 0; maximum: scan for largest y-value; slope (linear): calculate Δy/Δx between any two points. Use the method matching your representation! Quick comparison shortcuts: for y-intercepts, formulas are fastest (plug in x = 0), but graphs let you just read off where it crosses the y-axis. For maxima, graphs are easiest (visually find highest point), but formulas of quadratics give exact vertex. For growth rates, tables let you calculate differences (linear) or ratios (exponential) directly. Play to each representation's strengths—don't convert everything to formulas if the feature is obvious in the given form! Efficient comparison means using the representation smartly.