Graphing Hyperbolic Inequalities - Algebra 2
Card 1 of 40
Which inequality does this graph represent?

Which inequality does this graph represent?
Tap to reveal answer
The hyperbola in the question's graph is  .
.
This could be discerned because it subtracts  from
from  and not the other way around, putting the zeros on the
  axis. This narrows the answers down to
  and
and  .
.
Test a point to tell which inequality is being used in the graph.
The point ") is within the shaded region, for example.
is within the shaded region, for example.
 , which is greater than 16, so the answer is
  .
.
The hyperbola in the question's graph is
This could be discerned because it subtracts
Test a point to tell which inequality is being used in the graph.
The point
← Didn't Know|Knew It →
Which inequality does this graph represent?

Which inequality does this graph represent?
Tap to reveal answer
The hyperbola in the graph has y-intercepts rather than x-intercepts, so the equation must be in the form  and not the other way around.
The y-intercepts are at 1 and -1, so the correct equation will have just  and not
  .
.
The answer not must either be,
 or
or  .
.
To see which, test a point in the shaded area.
For example, ") .
.
 , which is less than 1, so the answer is
  .
.
The hyperbola in the graph has y-intercepts rather than x-intercepts, so the equation must be in the form
The y-intercepts are at 1 and -1, so the correct equation will have just
The answer not must either be,
To see which, test a point in the shaded area.
For example,
← Didn't Know|Knew It →
Which of the following inequalities is not hyperbolic?
Which of the following inequalities is not hyperbolic?
Tap to reveal answer
The equation for a horizontal hyperbola is . The equation for a vertical hyperbola is
  . Hyperbolic inequalities use an inequality sign rather than an equals sign, but otherwise have the same form as hyperbolic equations. The fact that the right side of the inequality is not equal to 1 does not change the fact that
  ,
,  and
and  represent hyperbolas, since THESE can all be simplified to create an inequality with 1 on the right side (by dividing both sides of the equation by the constant on the right side of the inequality.) Answer choice
  is the only option in which the two terms on the left side of the inequality are combined using addition rather than subtraction, creating an ellipse rather than a hyperbola. (The equation for an ellipse is
  .)
.)
The equation for a horizontal hyperbola is


← Didn't Know|Knew It →
Which of the following inequalities is not hyperbolic?
Which of the following inequalities is not hyperbolic?
Tap to reveal answer
The equation for a horizontal hyperbola is  . The equation for a vertical hyperbola is
  . Hyperbolic inequalities use an inequality sign rather than an equals sign, but otherwise have the same form as hyperbolic equations. The presence of coefficients in
  and
and  does not change the fact that
  and
and  represent hyperbolas, since both can be simplified to remove those coefficients (by dividing the numerator and denominator of terms with coefficients by those coefficients.) Answer choice
 ]/4 - $[(x-1)^2$]/25 > 1") is missing an exponent of 2 on the first term in the inequality, and therefore does not match the form of a hyperbola.
is missing an exponent of 2 on the first term in the inequality, and therefore does not match the form of a hyperbola.
The equation for a horizontal hyperbola is 


]/4 - $[(x-1)^2$]/25 > 1")
← Didn't Know|Knew It →
Which inequality does this graph represent?
Which inequality does this graph represent?
Tap to reveal answer
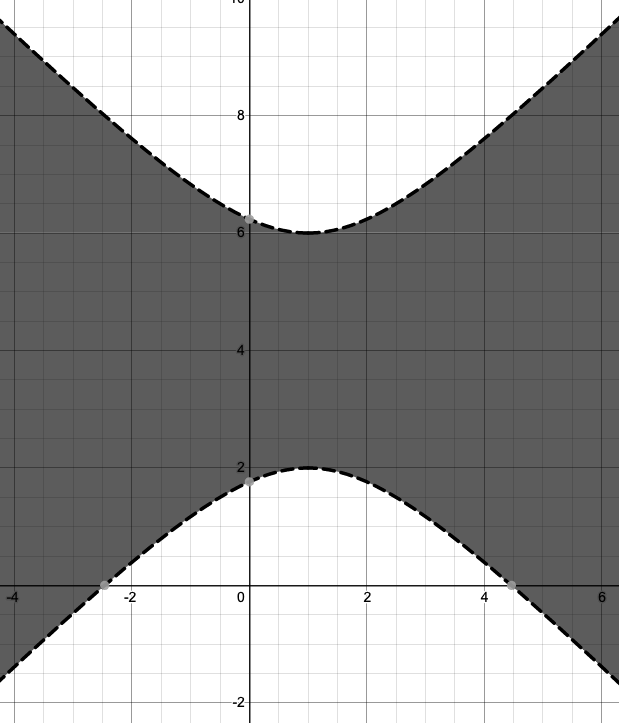
The equation for a horizontal hyperbola is  . The equation for a vertical hyperbola is
  . In both,
 ") is the center of the hyperbola. Hyperbolic inequalities use an inequality sign rather than an equals sign, but otherwise have the same form as hyperbolic equations. The graph shows a vertical hyperbola, so in its corresponding inequality the y-term must appear first. The center is shaded, so the left side of the graph’s corresponding inequality (the side containing the variables x and y) is less than the constant on the right side. The lines are dashed rather than solid, so the inequality sign must be
is the center of the hyperbola. Hyperbolic inequalities use an inequality sign rather than an equals sign, but otherwise have the same form as hyperbolic equations. The graph shows a vertical hyperbola, so in its corresponding inequality the y-term must appear first. The center is shaded, so the left side of the graph’s corresponding inequality (the side containing the variables x and y) is less than the constant on the right side. The lines are dashed rather than solid, so the inequality sign must be  rather than
  .
.
The equation for a horizontal hyperbola is 

")


← Didn't Know|Knew It →
Which inequality does this graph represent?
Which inequality does this graph represent?
Tap to reveal answer
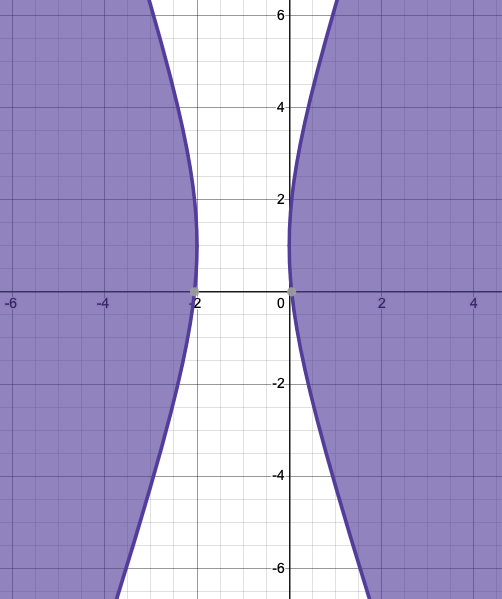
The equation for a horizontal hyperbola is  . The equation for a vertical hyperbola is
  . In both, (h, v) is the center of the hyperbola. Hyperbolic inequalities use an inequality sign rather than an equals sign, but otherwise have the same form as hyperbolic equations. The graph shows a horizontal hyperbola, so in its corresponding inequality the x-term must appear first. The center is not shaded, so the left side of the graph’s corresponding inequality (the side containing the variables x and y) is greater than the constant on the right side. The lines are dashed rather than solid, so the inequality sign must be
  rather than
  . The center lies at (-1, 1), so x must be followed by the constant 1, and y must be followed by the constant -1.
The equation for a horizontal hyperbola is 


← Didn't Know|Knew It →
Which inequality does this graph represent?
Which inequality does this graph represent?
Tap to reveal answer
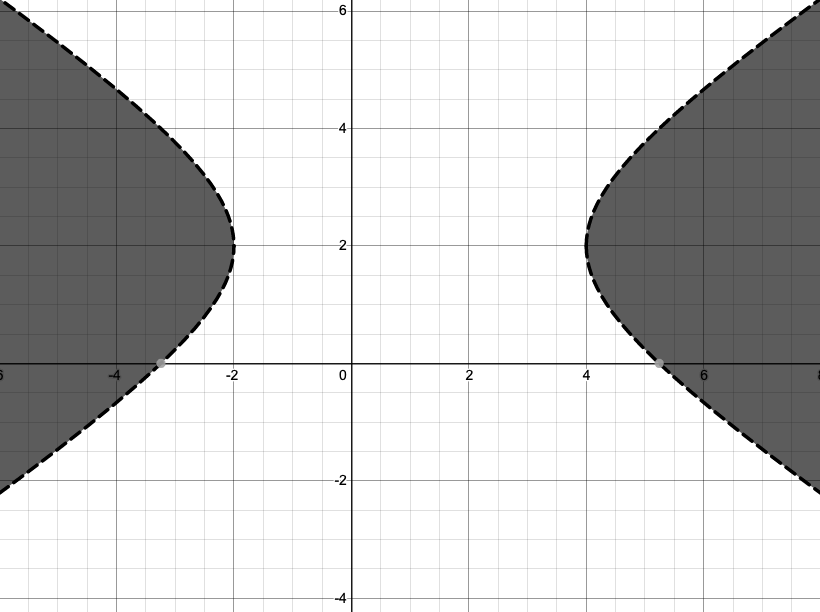
The equation for a horizontal hyperbola is  . The equation for a vertical hyperbola is
  . In both, (h, v) is the center of the hyperbola. Hyperbolic inequalities use an inequality sign rather than an equals sign, but otherwise have the same form as hyperbolic equations. The graph shows a horizontal hyperbola, so in its corresponding inequality the x-term must appear first. The center is not shaded, so the left side of the graph’s corresponding inequality (the side containing the variables x and y) is greater than the constant on the right side.
The equation for a horizontal hyperbola is 

← Didn't Know|Knew It →
Which inequality does this graph represent?
Which inequality does this graph represent?
Tap to reveal answer
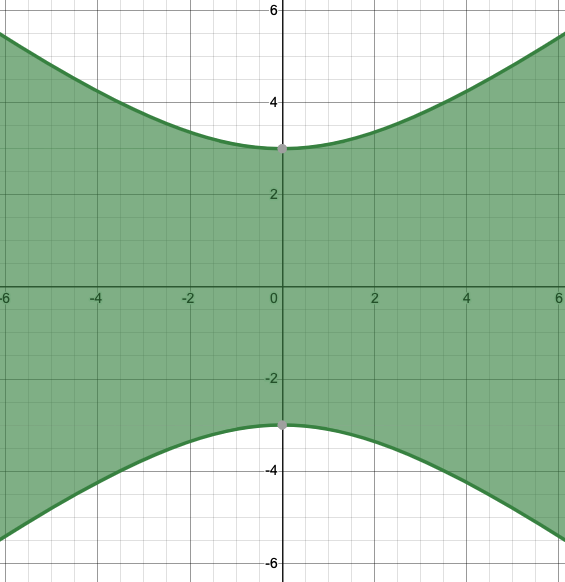
The equation for a horizontal hyperbola is  . The equation for a vertical hyperbola is
  . In both, (h, v) is the center of the hyperbola. Hyperbolic inequalities use an inequality sign rather than an equals sign, but otherwise have the same form as hyperbolic equations. The graph shows a vertical hyperbola, so in its corresponding inequality the y-term must appear first. The center is (0, 0), so neither x nor y can be followed by a constant. The center is shaded, so the left side of the graph’s corresponding inequality (the side containing the variables x and y) is less than the constant on the right side. The lines are solid rather than dashed, so the inequality sign must be
  rather than
  .
.
The equation for a horizontal hyperbola is 


← Didn't Know|Knew It →
Which graph represents the inequality  ?
?
Which graph represents the inequality 
Tap to reveal answer
The equation for a horizontal hyperbola is . The equation for a vertical hyperbola is
  . In both, (h, v) is the center of the hyperbola. Hyperbolic inequalities use an inequality sign rather than an equals sign, but otherwise have the same form as hyperbolic equations. Neither the x nor the y in the inequality are followed by constants, so the graph must be centered on (0,0). The x-term appears first, so the graph must show a horizontal hyperbola. The inequality sign is
  rather than
  , so the lines must be dashed rather than solid. The left side is less than rather than greater than the constant, so the center must be shaded.
The equation for a horizontal hyperbola is


← Didn't Know|Knew It →
Which graph represents the inequality  ?
?
Which graph represents the inequality 
Tap to reveal answer
The equation for a horizontal hyperbola is  . The equation for a vertical hyperbola is
  . In both, (h, v) is the center of the hyperbola. Hyperbolic inequalities use an inequality sign rather than an equals sign, but otherwise have the same form as hyperbolic equations. The x and y in the inequality are followed by the constants 2 and -1 respectively, so the graph must be centered on (-2, 1). The y-term appears first, so the graph must show a vertical hyperbola. The inequality sign is
  rather than
  , so the lines must be solid rather than dashed. The left side is greater than rather than less than the constant, so the center must not be shaded.
The equation for a horizontal hyperbola is 


← Didn't Know|Knew It →
Which inequality does this graph represent?
Which inequality does this graph represent?
Tap to reveal answer
The hyperbola in the question's graph is .
This could be discerned because it subtracts from and not the other way around, putting the zeros on the axis. This narrows the answers down to and .
Test a point to tell which inequality is being used in the graph.
The point is within the shaded region, for example.
, which is greater than 16, so the answer is .
The hyperbola in the question's graph is
This could be discerned because it subtracts
Test a point to tell which inequality is being used in the graph.
The point
← Didn't Know|Knew It →
Which inequality does this graph represent?
Which inequality does this graph represent?
Tap to reveal answer
The hyperbola in the graph has y-intercepts rather than x-intercepts, so the equation must be in the form and not the other way around.
The y-intercepts are at 1 and -1, so the correct equation will have just and not .
The answer not must either be,
or .
To see which, test a point in the shaded area.
For example, .
, which is less than 1, so the answer is .
The hyperbola in the graph has y-intercepts rather than x-intercepts, so the equation must be in the form
The y-intercepts are at 1 and -1, so the correct equation will have just
The answer not must either be,
To see which, test a point in the shaded area.
For example,
← Didn't Know|Knew It →
Which of the following inequalities is not hyperbolic?
Which of the following inequalities is not hyperbolic?
Tap to reveal answer
The equation for a horizontal hyperbola is. The equation for a vertical hyperbola is . Hyperbolic inequalities use an inequality sign rather than an equals sign, but otherwise have the same form as hyperbolic equations. The fact that the right side of the inequality is not equal to 1 does not change the fact that , and represent hyperbolas, since THESE can all be simplified to create an inequality with 1 on the right side (by dividing both sides of the equation by the constant on the right side of the inequality.) Answer choice is the only option in which the two terms on the left side of the inequality are combined using addition rather than subtraction, creating an ellipse rather than a hyperbola. (The equation for an ellipse is .)
The equation for a horizontal hyperbola is
← Didn't Know|Knew It →
Which of the following inequalities is not hyperbolic?
Which of the following inequalities is not hyperbolic?
Tap to reveal answer
The equation for a horizontal hyperbola is . The equation for a vertical hyperbola is . Hyperbolic inequalities use an inequality sign rather than an equals sign, but otherwise have the same form as hyperbolic equations. The presence of coefficients in and does not change the fact that and represent hyperbolas, since both can be simplified to remove those coefficients (by dividing the numerator and denominator of terms with coefficients by those coefficients.) Answer choice is missing an exponent of 2 on the first term in the inequality, and therefore does not match the form of a hyperbola.
The equation for a horizontal hyperbola is
← Didn't Know|Knew It →
Which inequality does this graph represent?
Which inequality does this graph represent?
Tap to reveal answer
The equation for a horizontal hyperbola is . The equation for a vertical hyperbola is . In both, is the center of the hyperbola. Hyperbolic inequalities use an inequality sign rather than an equals sign, but otherwise have the same form as hyperbolic equations. The graph shows a vertical hyperbola, so in its corresponding inequality the y-term must appear first. The center is shaded, so the left side of the graph’s corresponding inequality (the side containing the variables x and y) is less than the constant on the right side. The lines are dashed rather than solid, so the inequality sign must be rather than .
The equation for a horizontal hyperbola is
← Didn't Know|Knew It →
Which inequality does this graph represent?
Which inequality does this graph represent?
Tap to reveal answer
The equation for a horizontal hyperbola is . The equation for a vertical hyperbola is . In both, (h, v) is the center of the hyperbola. Hyperbolic inequalities use an inequality sign rather than an equals sign, but otherwise have the same form as hyperbolic equations. The graph shows a horizontal hyperbola, so in its corresponding inequality the x-term must appear first. The center is not shaded, so the left side of the graph’s corresponding inequality (the side containing the variables x and y) is greater than the constant on the right side. The lines are dashed rather than solid, so the inequality sign must be rather than . The center lies at (-1, 1), so x must be followed by the constant 1, and y must be followed by the constant -1.
The equation for a horizontal hyperbola is
← Didn't Know|Knew It →
Which inequality does this graph represent?
Which inequality does this graph represent?
Tap to reveal answer
The equation for a horizontal hyperbola is . The equation for a vertical hyperbola is . In both, (h, v) is the center of the hyperbola. Hyperbolic inequalities use an inequality sign rather than an equals sign, but otherwise have the same form as hyperbolic equations. The graph shows a horizontal hyperbola, so in its corresponding inequality the x-term must appear first. The center is not shaded, so the left side of the graph’s corresponding inequality (the side containing the variables x and y) is greater than the constant on the right side.
The equation for a horizontal hyperbola is
← Didn't Know|Knew It →
Which inequality does this graph represent?
Which inequality does this graph represent?
Tap to reveal answer
The equation for a horizontal hyperbola is . The equation for a vertical hyperbola is . In both, (h, v) is the center of the hyperbola. Hyperbolic inequalities use an inequality sign rather than an equals sign, but otherwise have the same form as hyperbolic equations. The graph shows a vertical hyperbola, so in its corresponding inequality the y-term must appear first. The center is (0, 0), so neither x nor y can be followed by a constant. The center is shaded, so the left side of the graph’s corresponding inequality (the side containing the variables x and y) is less than the constant on the right side. The lines are solid rather than dashed, so the inequality sign must be rather than .
The equation for a horizontal hyperbola is
← Didn't Know|Knew It →
Which graph represents the inequality ?
Which graph represents the inequality
Tap to reveal answer
The equation for a horizontal hyperbola is. The equation for a vertical hyperbola is . In both, (h, v) is the center of the hyperbola. Hyperbolic inequalities use an inequality sign rather than an equals sign, but otherwise have the same form as hyperbolic equations. Neither the x nor the y in the inequality are followed by constants, so the graph must be centered on (0,0). The x-term appears first, so the graph must show a horizontal hyperbola. The inequality sign is rather than , so the lines must be dashed rather than solid. The left side is less than rather than greater than the constant, so the center must be shaded.
The equation for a horizontal hyperbola is
← Didn't Know|Knew It →
Which graph represents the inequality ?
Which graph represents the inequality
Tap to reveal answer
The equation for a horizontal hyperbola is . The equation for a vertical hyperbola is . In both, (h, v) is the center of the hyperbola. Hyperbolic inequalities use an inequality sign rather than an equals sign, but otherwise have the same form as hyperbolic equations. The x and y in the inequality are followed by the constants 2 and -1 respectively, so the graph must be centered on (-2, 1). The y-term appears first, so the graph must show a vertical hyperbola. The inequality sign is rather than , so the lines must be solid rather than dashed. The left side is greater than rather than less than the constant, so the center must not be shaded.
The equation for a horizontal hyperbola is
← Didn't Know|Knew It →