Trigonometric Graphs - Trigonometry
Card 1 of 192
Let ") be a function defined as follows:
be a function defined as follows:
=-\sin(x+\pi)+4")
The 4 in the function above affects what attribute of the graph of ") ?
?
Let
=-\sin(x+\pi)+4")
The 4 in the function above affects what attribute of the graph of
Tap to reveal answer
The period of the function is indicated by the coefficient in front of  ; here the period is unchanged.
The amplitude of the function is given by the coefficient in front of the  ; here the amplitude is -1.
The phase shift is given by the value being added or subtracted inside the  function; here the shift is
  units to the right.
The only unexamined attribute of the graph is the vertical shift, so 4 is the vertical shift of the graph. A vertical shift of 4 means that the entire graph of the function will be moved up four units (in the positive y-direction).
The period of the function is indicated by the coefficient in front of
The amplitude of the function is given by the coefficient in front of the
The phase shift is given by the value being added or subtracted inside the
The only unexamined attribute of the graph is the vertical shift, so 4 is the vertical shift of the graph. A vertical shift of 4 means that the entire graph of the function will be moved up four units (in the positive y-direction).
← Didn't Know|Knew It →
Let be a function defined as follows:
=3\cos(x+\pi)-3")
What is the vertical shift in this function?
Let
=3\cos(x+\pi)-3")
What is the vertical shift in this function?
Tap to reveal answer
The period of the function is indicated by the coefficient in front of ; here the period is unchanged.
The amplitude of the function is given by the coefficient in front of the ; here the amplitude is 3.
The phase shift is given by the value being added or subtracted inside the cosine function; here the shift is units to the right.
The only unexamined attribute of the graph is the vertical shift, so -3 is the vertical shift of the graph. A vertical shift of -3 means that the entire graph of the function will be moved down three units (in the negative y-direction).
The period of the function is indicated by the coefficient in front of
The amplitude of the function is given by the coefficient in front of the
The phase shift is given by the value being added or subtracted inside the cosine function; here the shift is
The only unexamined attribute of the graph is the vertical shift, so -3 is the vertical shift of the graph. A vertical shift of -3 means that the entire graph of the function will be moved down three units (in the negative y-direction).
← Didn't Know|Knew It →
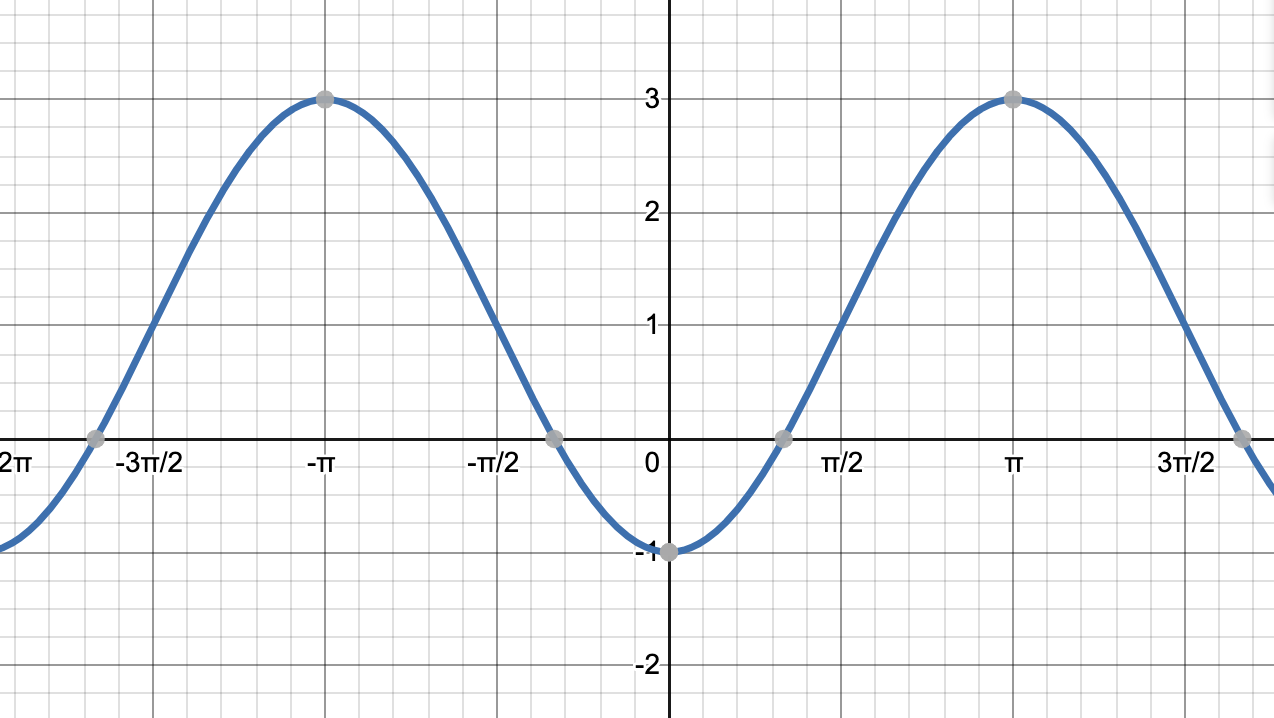
This graph shows a translated cosine function. Which of the following could be the equation of this graph?
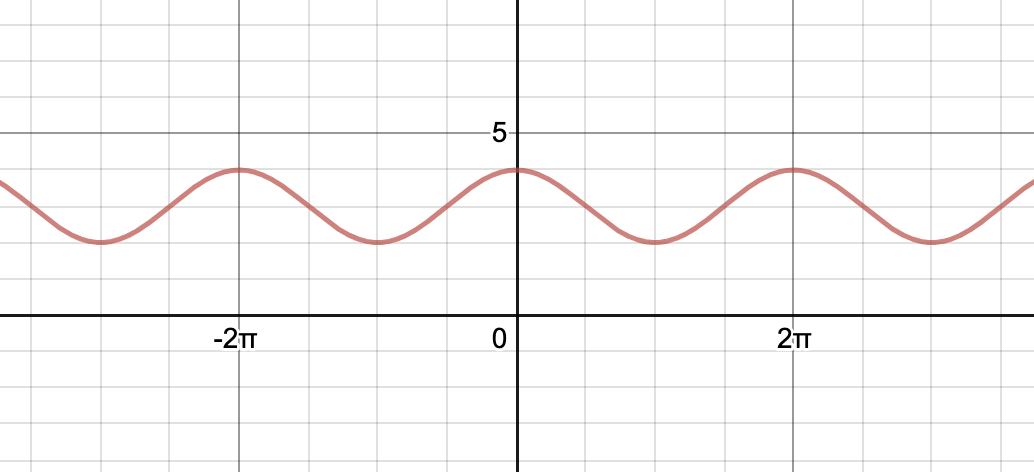
This graph shows a translated cosine function. Which of the following could be the equation of this graph?
Tap to reveal answer
The correct answer is =\cos x+3") . There are no sign changes with vertical shifts; in other words, when the function includes
. There are no sign changes with vertical shifts; in other words, when the function includes  , it directly translates to moving up three units. If you thought the answer was
 =\cos x+4") , you may have spotted the y-intercept at
, you may have spotted the y-intercept at ") and jumped to this answer. However, recall that the y-intercept of a regular
and jumped to this answer. However, recall that the y-intercept of a regular  function is at the point
 ") . Beginning at
. Beginning at ") and ending at
and ending at ") corresponds to a vertical shift of 3 units.
corresponds to a vertical shift of 3 units.
The correct answer is =\cos x+3")

=\cos x+4")
")

")
")
")
← Didn't Know|Knew It →
The graph below shows a translated sine function. Which of the following functions could be shown by this graph?
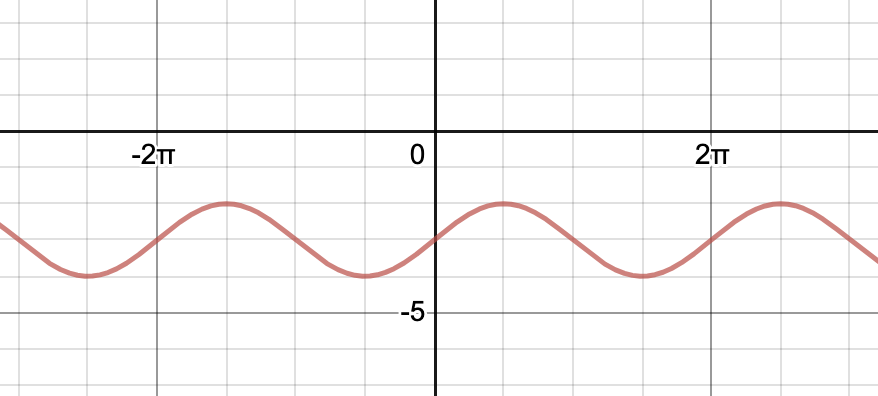
The graph below shows a translated sine function. Which of the following functions could be shown by this graph?
Tap to reveal answer
A normal  graph has its y-intercept at
 ") . This graph has its y-intercept at
. This graph has its y-intercept at ") . Therefore, the graph was shifted down three units. Therefore the function of this graph is
. Therefore, the graph was shifted down three units. Therefore the function of this graph is  .
.
A normal 
")
")

← Didn't Know|Knew It →
Consider the function ) +10") . What is the vertical shift of this function?
. What is the vertical shift of this function?
Consider the function ) +10")
Tap to reveal answer
The general form for the secant transformation equation is )") .
.  represents the phase shift of the function. When considering
 ) +10") we see that
we see that  , so our vertical shift is
  and we would shift this function
  units up from the original secant function’s graph.
The general form for the secant transformation equation is )")

) +10")


← Didn't Know|Knew It →
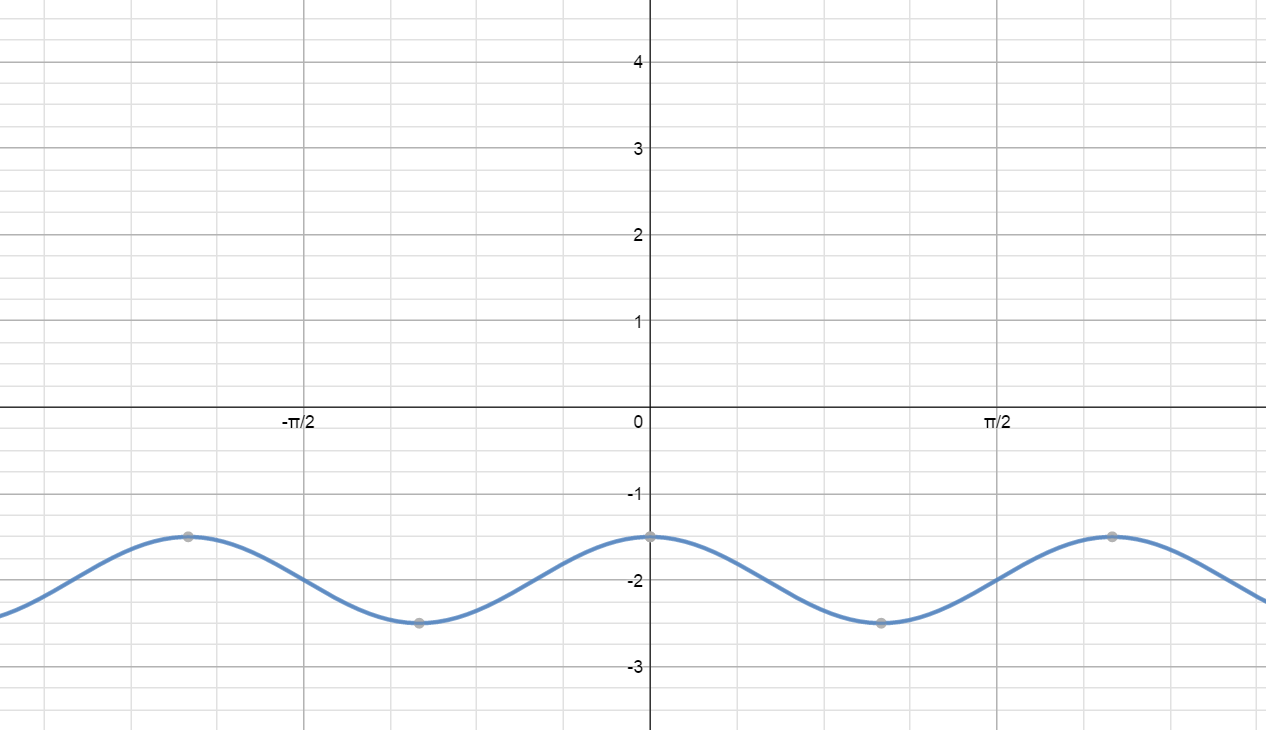
Which of the following is the graph of  with a vertical shift of
  ?
?
Which of the following is the graph of 

Tap to reveal answer
The graph of  with a vertical shift of
  is shown below. This can also be expressed as
  .
.
Here is a graph that shows both  and
and  , so that you can see the "before" and "after." The original function is in blue and the translated function is in purple.
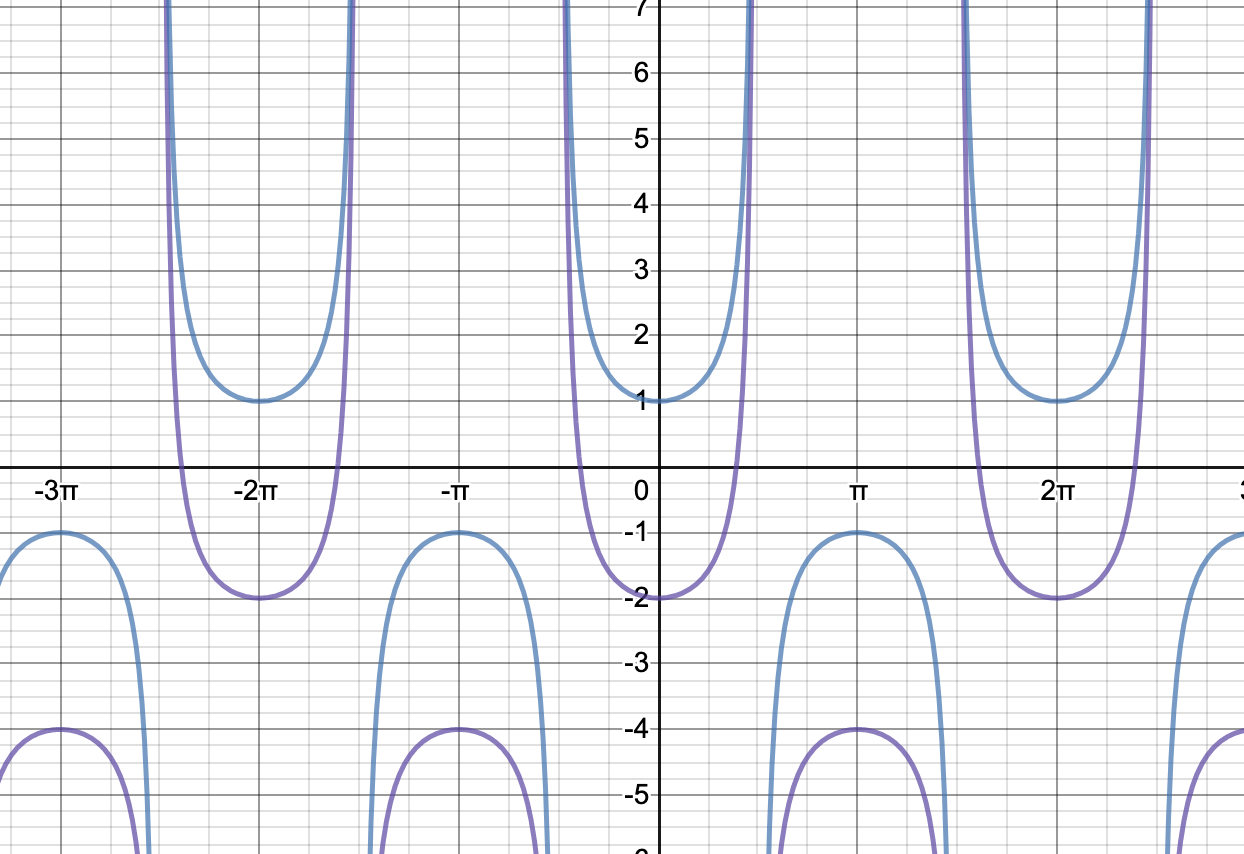
The graphs of the incorrect answer choices are  (no vertical shift applied),
  (shifted upwards instead of downwards),
  (amplitude modified, and shifted upwards instead of downwards), and
  (shifted downwards 3 units, but this is not the correct original graph of simply
  since the amplitude was modified.)
The graph of 


Here is a graph that shows both 

The graphs of the incorrect answer choices are 


← Didn't Know|Knew It →
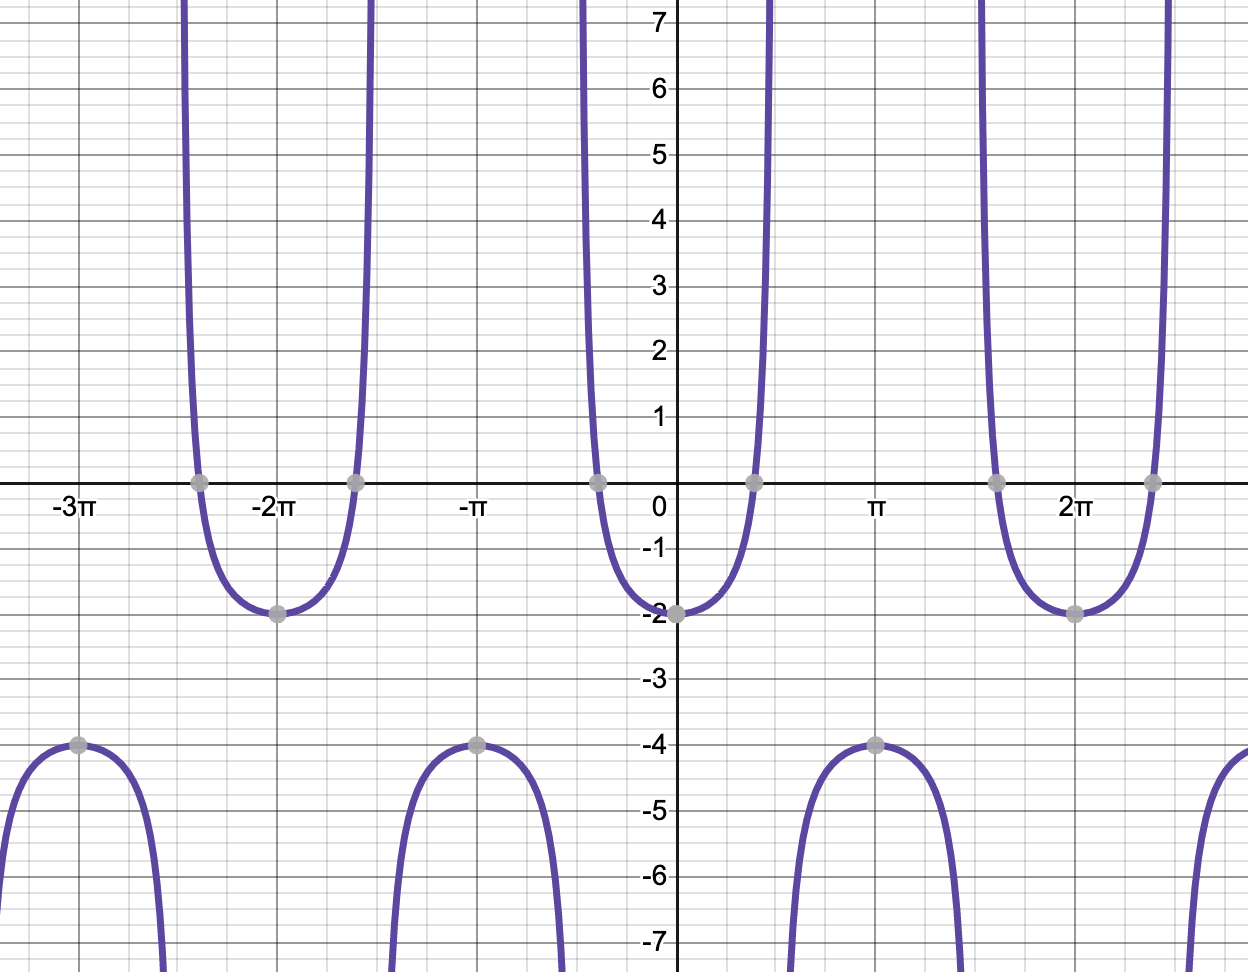
Which of the following graphs shows one of the original six trigonometric functions with a vertical shift of  applied?
Which of the following graphs shows one of the original six trigonometric functions with a vertical shift of 
Tap to reveal answer
We are looking for an answer choice that has one of the six trigonometric functions, as well as that function shifted up 3 units. The only answer choice that displays that is this graph of  (purple) and
  (blue).
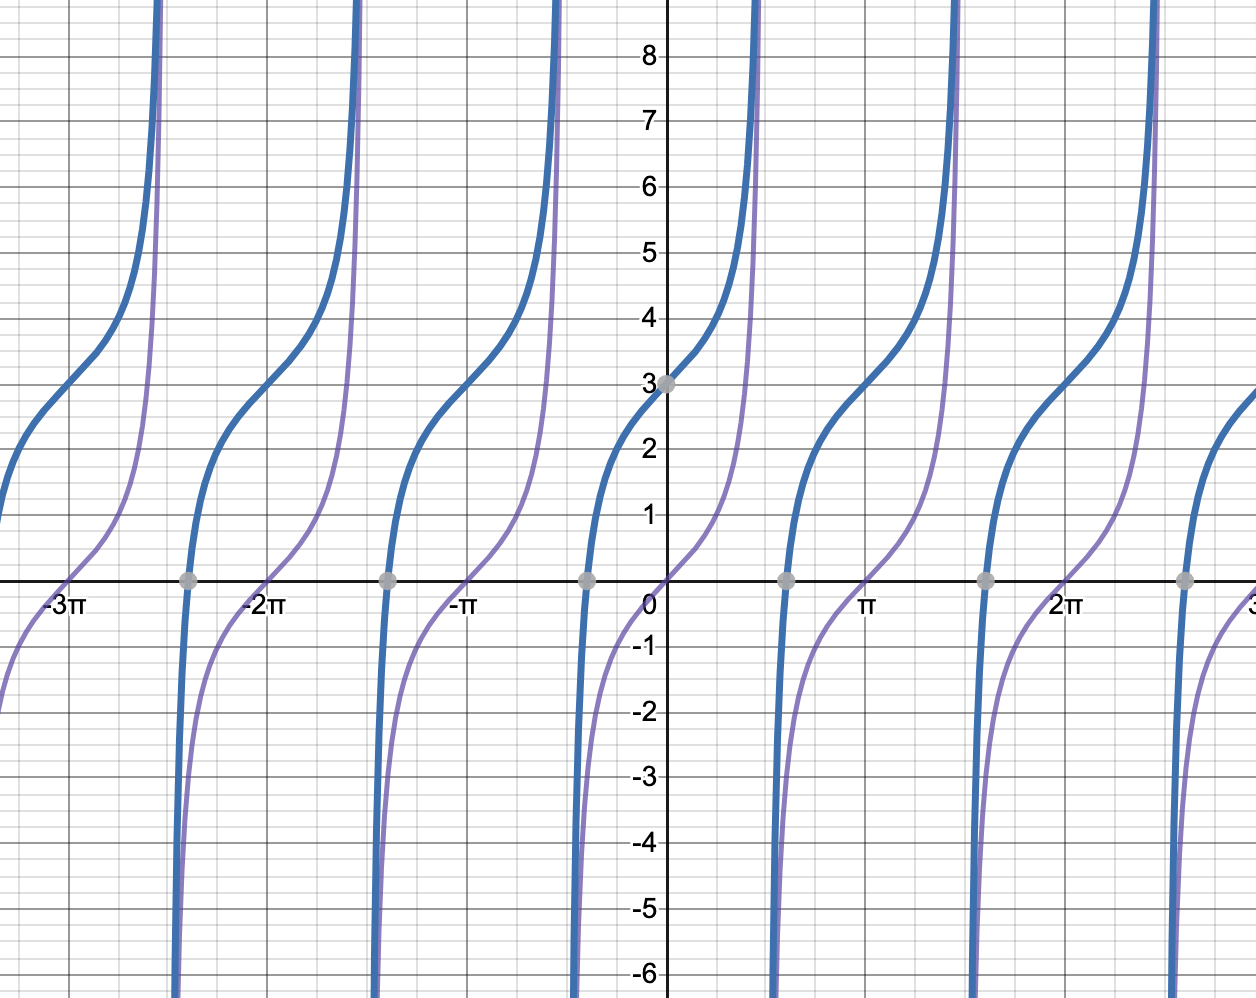
The incorrect answers depict  and
and  ,
,  and
and  , and
, and  and
and ") .
.
We are looking for an answer choice that has one of the six trigonometric functions, as well as that function shifted up 3 units. The only answer choice that displays that is this graph of 

The incorrect answers depict 


")
← Didn't Know|Knew It →
Which of the following graphs does not have a  -intercept at
  ?
?
Which of the following graphs does not have a
Tap to reveal answer
The y-intercept is the value of y when  .
.
Recall that cosine is the  value of the unit circle. Thus,
  = 1") , so it works.
, so it works.
Secant is the reciprocal of cosine, so it also works.
Also recall that  = sin(90 - x)") . Thus, the only answer which is not equivalent is
. Thus, the only answer which is not equivalent is ") .
.
The y-intercept is the value of y when
Recall that cosine is the
Secant is the reciprocal of cosine, so it also works.
Also recall that
← Didn't Know|Knew It →
This is the graph of what function?
This is the graph of what function?
Tap to reveal answer
The amplitude of the sine function is increased by 3, so this is the coefficient for ") . The +2 shows that the origin of the function is now at
. The +2 shows that the origin of the function is now at  instead of
The amplitude of the sine function is increased by 3, so this is the coefficient for
← Didn't Know|Knew It →
The function shown below has an amplitude of and a period of .
 = -4cos(3\pi x) +3")
The function shown below has an amplitude of and a period of .
Tap to reveal answer
The amplitude is always a positive number and is given by the number in front of the trigonometric function. In this case, the amplitude is 4. The period is given by  , where b is the number in front of x. In this case, the period is
  .
.
The amplitude is always a positive number and is given by the number in front of the trigonometric function. In this case, the amplitude is 4. The period is given by
← Didn't Know|Knew It →
What is an equation for the above function, enlarged below?
What is an equation for the above function, enlarged below?
Tap to reveal answer
The amplitude of a sinusoidal function is  unless amplified by a constant in front of the equation. In this case, the amplitude is
  , so the front constant is
  .
.
The graph moves through the origin, so it is either a sine or a shifted cosine graph.
It repeats once in every  , as opposed to the usual
  , so the period is doubled, the constant next to the variable is
  .
.
The only answer in which both the correct amplitude and period is found is:
")
The amplitude of a sinusoidal function is
The graph moves through the origin, so it is either a sine or a shifted cosine graph.
It repeats once in every
The only answer in which both the correct amplitude and period is found is:
← Didn't Know|Knew It →
Which graph correctly illustrates the given equation?
-2")
Which graph correctly illustrates the given equation?
Tap to reveal answer
The simplest way to solve a problem like this is to determine where a particular point on the graph would lie and then compare that to our answer choices. We should first find the y-value when the x-value is equal to zero. We will start by substituting zero in for the x-variable in our equation.
)-2=\frac{1}{2}$cos(0)-2")
-2=\frac{1}{2}$(1)-2")
-2=\frac{1}{2}$-2")

Now that we have calculated the y-value we know that the correct graph must have the following point:
")
Unfortunately, two of our graph choices include this point; thus, we need to pick a second point.
Let's find the y-value when the x-variable equals the following:

We will begin by substituting this into our original equation.
\right)-2=\frac{1}{2}$cos \left( $\frac{3\pi}{2}$ \right)-2")
-2=\frac{1}{2}$(0)-2")
-2=0-2=-2")
Now we need to investigate the two remaining choices for the following point:
")
Unfortunately, both of our remaining graphs have this point as well; therefore, we need to pick another x-value. Suppose the x-variable equals the following:

Now, we must substitute this value into our given equation.
\right)-2=\frac{1}{2}$cos\left($\frac{3\pi}{4}\right)-2")
-2=\frac{1}{2}$\left(-$\frac{\sqrt{2}$}{2}\right)-2")
-2=-$\frac{\sqrt{2}$}{4}-2")

Now, we can look for the graph with the following point:
")
We have narrowed in on our final answer; thus, the following graph is correct:
The simplest way to solve a problem like this is to determine where a particular point on the graph would lie and then compare that to our answer choices. We should first find the y-value when the x-value is equal to zero. We will start by substituting zero in for the x-variable in our equation.
)-2=\frac{1}{2}$cos(0)-2")
-2=\frac{1}{2}$(1)-2")
-2=\frac{1}{2}$-2")

Now that we have calculated the y-value we know that the correct graph must have the following point:
")
Unfortunately, two of our graph choices include this point; thus, we need to pick a second point.
Let's find the y-value when the x-variable equals the following:
We will begin by substituting this into our original equation.
\right)-2=\frac{1}{2}$cos \left( $\frac{3\pi}{2}$ \right)-2")
-2=\frac{1}{2}$(0)-2")
-2=0-2=-2")
Now we need to investigate the two remaining choices for the following point:
")
Unfortunately, both of our remaining graphs have this point as well; therefore, we need to pick another x-value. Suppose the x-variable equals the following:
Now, we must substitute this value into our given equation.
\right)-2=\frac{1}{2}$cos\left($\frac{3\pi}{4}\right)-2")
-2=\frac{1}{2}$\left(-$\frac{\sqrt{2}$}{2}\right)-2")
-2=-$\frac{\sqrt{2}$}{4}-2")
Now, we can look for the graph with the following point:
")
We have narrowed in on our final answer; thus, the following graph is correct:
← Didn't Know|Knew It →
Let be a function defined as follows:
=2\sin(x-\pi)+3") .
.
The 3 in the function above affects what attribute of the graph of ?
Let
The 3 in the function above affects what attribute of the graph of
Tap to reveal answer
The period of the function is indicated by the coefficient in front of ; here the period is unchanged.
The amplitude of the function is given by the coefficient in front of the ; here the amplitude is 2.
The phase shift is given by the value being added or subtracted inside the function; here the shift is units to the right.
The only unexamined attribute of the graph is the vertical shift, so 3 is the vertical shift of the graph.
The period of the function is indicated by the coefficient in front of
The amplitude of the function is given by the coefficient in front of the
The phase shift is given by the value being added or subtracted inside the
The only unexamined attribute of the graph is the vertical shift, so 3 is the vertical shift of the graph.
← Didn't Know|Knew It →
What is the domain of the sine function? What is the domain of the cosine function?
What is the domain of the sine function? What is the domain of the cosine function?
Tap to reveal answer
Both sine and cosine functions go on infinitely to the left and right when viewed on a graph. For this reason, each of these functions has domains of "all real numbers."
Alternatively, each of these functions ranges between -1 and 1 in the y direction. The incorrect answers all include  , which is the range of both the sine and the cosine functions.
Both sine and cosine functions go on infinitely to the left and right when viewed on a graph. For this reason, each of these functions has domains of "all real numbers."
Alternatively, each of these functions ranges between -1 and 1 in the y direction. The incorrect answers all include 
← Didn't Know|Knew It →
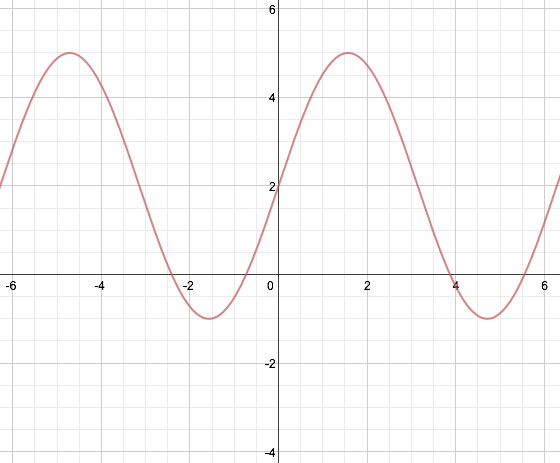
Which of the following would correctly translate the function  into
into  ?
?
Which of the following would correctly translate the function 

Tap to reveal answer
The graph of  is shown in red below, and the graph of
  is shown in blue below. Because the function is periodic, there are infinitely many transformations that could allow
  to translate into
  , but there is only one answer choice below that is correct, and that is "shift
  to the left
  units." Per the graph, shifting
  to the right
  units would also be correct, but that is not an available answer choice.

The graph of 


← Didn't Know|Knew It →
Which of the following graphs represents the function =-2\cos x+1") ?
?
Which of the following graphs represents the function =-2\cos x+1")
Tap to reveal answer
The graph of =-2\cos x+1") is:
is:
This graph goes through three transformations. First, take the graph of  , in blue below, and flip it over the x-axis. We do this because of the negative sign in front of the cosine function. You can see the resulting graph in green below. Next, we want to stretch the graph by a factor of 2, since our amplitude is 2 (we get this from the coefficient in front of the cosine function). You can see the resulting graph in purple, below.

Finally, we need to shift the graph up 1 unit. This is represented by the black graph, below.

The incorrect answers display the graphs of the functions =2\cos x +1") ,
, =-2\cos x +4") , and
, and =-\cos x +3") .
.
The graph of =-2\cos x+1")
This graph goes through three transformations. First, take the graph of 
Finally, we need to shift the graph up 1 unit. This is represented by the black graph, below.
The incorrect answers display the graphs of the functions =2\cos x +1")
=-2\cos x +4")
=-\cos x +3")
← Didn't Know|Knew It →
This is the graph of what function of x?

This is the graph of what function of x?
Tap to reveal answer
") is shown in red, and
is shown in red, and ") is shown in blue.
is shown in blue.
=\frac{1}{\cos(x)}$")

← Didn't Know|Knew It →
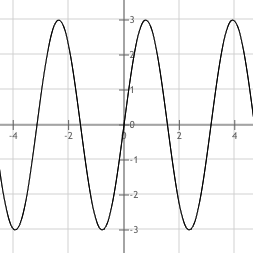
Give the equation of the following graph.

Give the equation of the following graph.
Tap to reveal answer
Looking at our graph, we can tell that the period is  . Using the formula
 where
where  is the coefficient of
  and
and  is the period, we can calculate

This eliminates one answer choice. We then retrun to our graph and see that the amplitude is 3. Remembering that the amplitude is the number in front of the function, we can eliminate two more choices.
We then examine our graph and realize it contains the point ") . Plugging 0 into our two remaining choices, we can determine which one gives us 4 for a result.
. Plugging 0 into our two remaining choices, we can determine which one gives us 4 for a result.
Looking at our graph, we can tell that the period is
This eliminates one answer choice. We then retrun to our graph and see that the amplitude is 3. Remembering that the amplitude is the number in front of the function, we can eliminate two more choices.
We then examine our graph and realize it contains the point
← Didn't Know|Knew It →
Which of the following is the graph of ") ?
?
Which of the following is the graph of ")
Tap to reveal answer
In order to graph ") , recall that
, recall that  = $\frac{1}{sin(x)}$") . First consider the graph
. First consider the graph ") .
.

Now anywhere this graph crosses the x-axis a vertical asymptote will form for the ") graph because the denominator of
graph because the denominator of }$") will be equal to zero and the function will be undefined. At each maximum and minimum of
will be equal to zero and the function will be undefined. At each maximum and minimum of ") , the graph of
, the graph of ") will invert at that point.
will invert at that point.

And then we are left with the graph of ") .
.

In order to graph ")
 = $\frac{1}{sin(x)}$")
")
Now anywhere this graph crosses the x-axis a vertical asymptote will form for the ")
}$")
")
")
And then we are left with the graph of ")
← Didn't Know|Knew It →
Considering the general form of the cosecant transformation function )") , what does each letter, (A, B, C, and D) correspond to?
, what does each letter, (A, B, C, and D) correspond to?
Considering the general form of the cosecant transformation function )")
Tap to reveal answer
Since cosecant is a reciprocal of sine, it uses the same general formula of the sine function with the letters corresponding to the same transformations. Note that while A does correspond to amplitude, the cosecant function extends infinitely upwards and downwards so there is no amplitude for the graphs.
Since cosecant is a reciprocal of sine, it uses the same general formula of the sine function with the letters corresponding to the same transformations. Note that while A does correspond to amplitude, the cosecant function extends infinitely upwards and downwards so there is no amplitude for the graphs.
← Didn't Know|Knew It →