How to read graphs - SSAT Upper Level: Quantitative
Card 1 of 24
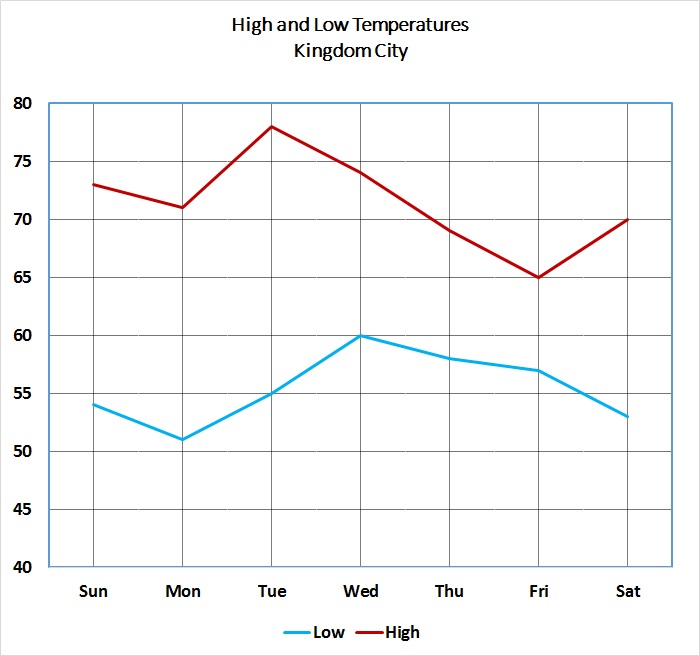
Refer to the above graph, which shows the high and low temperatures for Kingdom City over a one-week period.
Which of the following temperatures occurred at least once on each of the seven days?
Refer to the above graph, which shows the high and low temperatures for Kingdom City over a one-week period.
Which of the following temperatures occurred at least once on each of the seven days?
Tap to reveal answer
The graph is recreated in the figure below, with horizontal lines at the 57, 62, 67, and 72 degree levels.
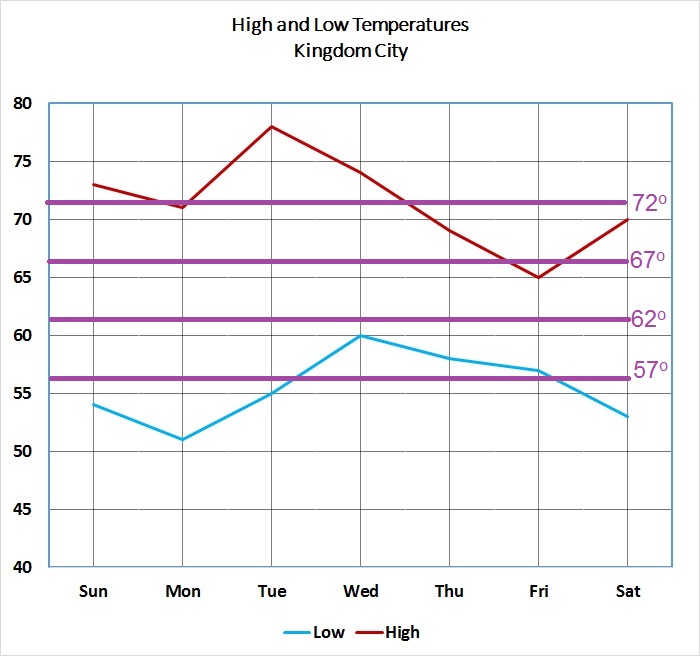
It can be seen that of the four lines, only the 62 degree line falls between the high temperature and low temperature for each of the seven days. This is the correct choice.
The graph is recreated in the figure below, with horizontal lines at the 57, 62, 67, and 72 degree levels.
It can be seen that of the four lines, only the 62 degree line falls between the high temperature and low temperature for each of the seven days. This is the correct choice.
← Didn't Know|Knew It →

The above figure shows two black quarter-circles inscribed inside a rectangle. If the black region has area 200, what is the area of the white region (nearest tenth)?
The above figure shows two black quarter-circles inscribed inside a rectangle. If the black region has area 200, what is the area of the white region (nearest tenth)?
Tap to reveal answer
If the radius of each quarter-circle is  , the black region has area

Set  and solve for
  :
:


The area of the rectangle, which we will call  , is
, is

The area of the white region is the difference of these two areas, or

If the radius of each quarter-circle is
Set
The area of the rectangle, which we will call
The area of the white region is the difference of these two areas, or
← Didn't Know|Knew It →
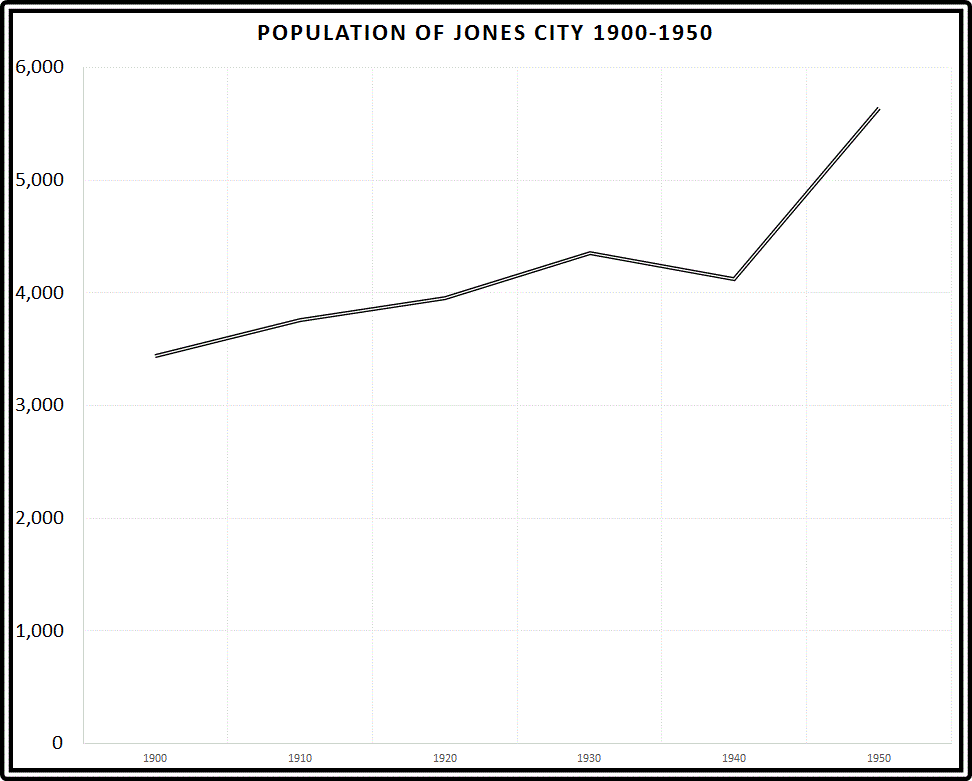
Refer to the above graph. Which of the following comes closest to the percent of increase in population enjoyed by Jones City between 1900 and 1950?
Refer to the above graph. Which of the following comes closest to the percent of increase in population enjoyed by Jones City between 1900 and 1950?
Tap to reveal answer
In 1900, the population was about 3,500; in 1950, it was about 5,600. A reasonable estimate of the percent of increase would be

so 60% would be the most reasonable choice.
In 1900, the population was about 3,500; in 1950, it was about 5,600. A reasonable estimate of the percent of increase would be
so 60% would be the most reasonable choice.
← Didn't Know|Knew It →
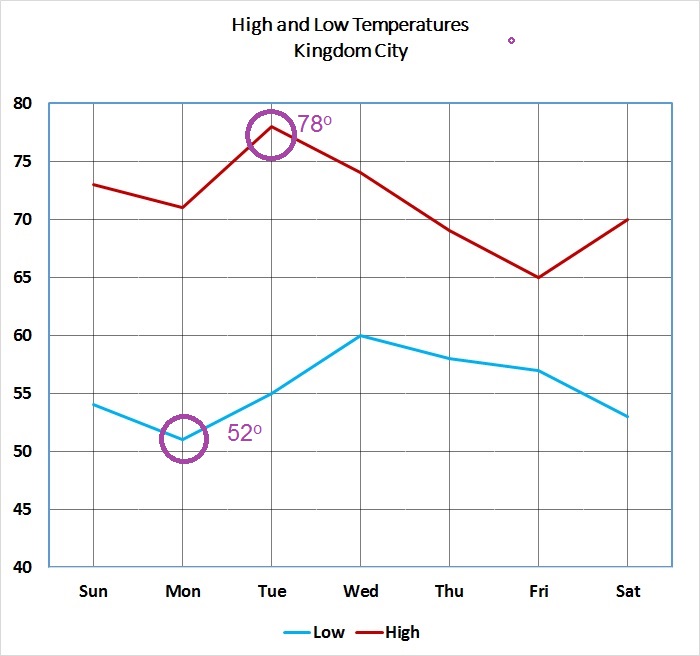
Refer to the above graph, which shows the high and low temperatures for Kingdom City over a one-week period. The temperatures at left are given in degrees Fahrenheit.
Temperatures given in degrees Fahrenheit can be converted to the Celsius scale using the formula
") .
.
Express the lowest temperature of the week in degrees Celsius (nearest whole degree).
Refer to the above graph, which shows the high and low temperatures for Kingdom City over a one-week period. The temperatures at left are given in degrees Fahrenheit.
Temperatures given in degrees Fahrenheit can be converted to the Celsius scale using the formula
Express the lowest temperature of the week in degrees Celsius (nearest whole degree).
Tap to reveal answer
As can be seen below, the lowest temperature for the week was  , on Monday.
To convert this to degrees Celsius, set  and substitute in the given formula:
")
 = $\frac{5}{9}$ \cdot 20= 11 $\frac{1}{9}$ ^{\circ }C") degrees Celsius. The closest choice is
degrees Celsius. The closest choice is  .
.
As can be seen below, the lowest temperature for the week was
To convert this to degrees Celsius, set
← Didn't Know|Knew It →
Refer to the above graph, which shows the high and low temperatures for Kingdom City over a one-week period. The temperatures at left are given in degrees Fahrenheit.
Temperatures given in degrees Fahrenheit can be converted to the Celsius scale using the formula
")
What was the difference, in degrees Celsius, between the highest temperature and the lowest temperature for the week (to the nearest whole degree)?
Refer to the above graph, which shows the high and low temperatures for Kingdom City over a one-week period. The temperatures at left are given in degrees Fahrenheit.
Temperatures given in degrees Fahrenheit can be converted to the Celsius scale using the formula
What was the difference, in degrees Celsius, between the highest temperature and the lowest temperature for the week (to the nearest whole degree)?
Tap to reveal answer
As can be seen below, the highest temperature for the week was  , on Tuesday; the low temperature,
  , on Monday.
To convert the former to degrees Celsius, set  and substitute in the given formula:
")
 = $\frac{5}{9}$ \cdot 46= 25 $\frac{5}{9}$ ^{\circ } C") .
.
To convert the latter, do the same, with  .
.
 = $\frac{5}{9}$ \cdot 20= 11$\frac{1}{9}$ ^{\circ } C") .
.
The difference is
 , which rounds to
  .
.
As can be seen below, the highest temperature for the week was
To convert the former to degrees Celsius, set
To convert the latter, do the same, with
The difference is
← Didn't Know|Knew It →
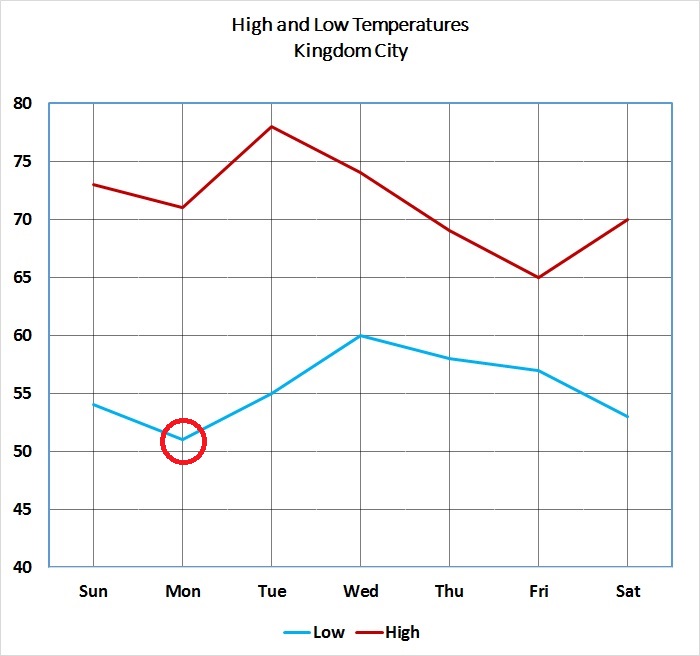
Refer to the above graph, which shows the high and low temperatures for Kingdom City over a one-week period.
Tim wants to know the high temperature for the Sunday of the next week. He does not have access to that information, but he knows that it was higher than those of exactly four of the five previous days, and lower than that of one of them. Which of the following temperatures could have been the high temperature for that day?
Tap to reveal answer
Since we are dealing with the day after the last one shown, and we are comparing that day's high temperature to those of the previous five days, we only need to concern ourselves with the high temperatures for Tuesday through Saturday.
Examine the figure below, which shows the high temperature line for those five days.
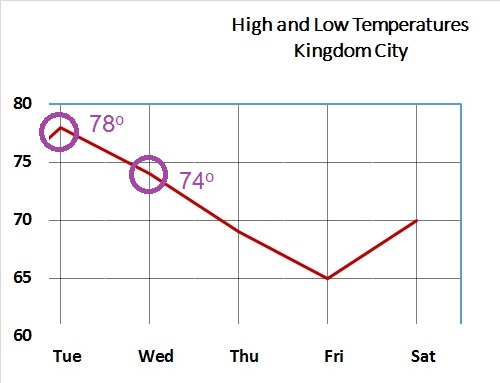
For the high temperature for the next Sunday to be greater than exactly four of the five and less than the remaining one, the temperature must be strictly between the highest and second-highest high temperatures, which are seen to be 78 and 74 degrees, respectively. That is, if we let  be the temperature in degrees,

Of the four choices, only 75 falls in this range.
Since we are dealing with the day after the last one shown, and we are comparing that day's high temperature to those of the previous five days, we only need to concern ourselves with the high temperatures for Tuesday through Saturday.
Examine the figure below, which shows the high temperature line for those five days.
For the high temperature for the next Sunday to be greater than exactly four of the five and less than the remaining one, the temperature must be strictly between the highest and second-highest high temperatures, which are seen to be 78 and 74 degrees, respectively. That is, if we let
Of the four choices, only 75 falls in this range.
← Didn't Know|Knew It →
The above figure shows two black quarter-circles inscribed inside a rectangle. If the black region has area 200, what is the area of the white region (nearest tenth)?
The above figure shows two black quarter-circles inscribed inside a rectangle. If the black region has area 200, what is the area of the white region (nearest tenth)?
Tap to reveal answer
If the radius of each quarter-circle is , the black region has area
Set and solve for :
The area of the rectangle, which we will call , is
The area of the white region is the difference of these two areas, or
If the radius of each quarter-circle is
Set
The area of the rectangle, which we will call
The area of the white region is the difference of these two areas, or
← Didn't Know|Knew It →
Refer to the above graph. Which of the following comes closest to the percent of increase in population enjoyed by Jones City between 1900 and 1950?
Refer to the above graph. Which of the following comes closest to the percent of increase in population enjoyed by Jones City between 1900 and 1950?
Tap to reveal answer
In 1900, the population was about 3,500; in 1950, it was about 5,600. A reasonable estimate of the percent of increase would be
so 60% would be the most reasonable choice.
In 1900, the population was about 3,500; in 1950, it was about 5,600. A reasonable estimate of the percent of increase would be
so 60% would be the most reasonable choice.
← Didn't Know|Knew It →
Refer to the above graph, which shows the high and low temperatures for Kingdom City over a one-week period. The temperatures at left are given in degrees Fahrenheit.
Temperatures given in degrees Fahrenheit can be converted to the Celsius scale using the formula
.
Express the lowest temperature of the week in degrees Celsius (nearest whole degree).
Refer to the above graph, which shows the high and low temperatures for Kingdom City over a one-week period. The temperatures at left are given in degrees Fahrenheit.
Temperatures given in degrees Fahrenheit can be converted to the Celsius scale using the formula
Express the lowest temperature of the week in degrees Celsius (nearest whole degree).
Tap to reveal answer
As can be seen below, the lowest temperature for the week was , on Monday.
To convert this to degrees Celsius, set and substitute in the given formula:
degrees Celsius. The closest choice is .
As can be seen below, the lowest temperature for the week was
To convert this to degrees Celsius, set
← Didn't Know|Knew It →
Refer to the above graph, which shows the high and low temperatures for Kingdom City over a one-week period.
Which of the following temperatures occurred at least once on each of the seven days?
Refer to the above graph, which shows the high and low temperatures for Kingdom City over a one-week period.
Which of the following temperatures occurred at least once on each of the seven days?
Tap to reveal answer
The graph is recreated in the figure below, with horizontal lines at the 57, 62, 67, and 72 degree levels.
It can be seen that of the four lines, only the 62 degree line falls between the high temperature and low temperature for each of the seven days. This is the correct choice.
The graph is recreated in the figure below, with horizontal lines at the 57, 62, 67, and 72 degree levels.
It can be seen that of the four lines, only the 62 degree line falls between the high temperature and low temperature for each of the seven days. This is the correct choice.
← Didn't Know|Knew It →
Refer to the above graph, which shows the high and low temperatures for Kingdom City over a one-week period. The temperatures at left are given in degrees Fahrenheit.
Temperatures given in degrees Fahrenheit can be converted to the Celsius scale using the formula
What was the difference, in degrees Celsius, between the highest temperature and the lowest temperature for the week (to the nearest whole degree)?
Tap to reveal answer
As can be seen below, the highest temperature for the week was , on Tuesday; the low temperature, , on Monday.
To convert the former to degrees Celsius, set and substitute in the given formula:
.
To convert the latter, do the same, with .
.
The difference is
, which rounds to .
As can be seen below, the highest temperature for the week was
To convert the former to degrees Celsius, set
To convert the latter, do the same, with
The difference is
← Didn't Know|Knew It →
Refer to the above graph, which shows the high and low temperatures for Kingdom City over a one-week period.
Tim wants to know the high temperature for the Sunday of the next week. He does not have access to that information, but he knows that it was higher than those of exactly four of the five previous days, and lower than that of one of them. Which of the following temperatures could have been the high temperature for that day?
Tap to reveal answer
Since we are dealing with the day after the last one shown, and we are comparing that day's high temperature to those of the previous five days, we only need to concern ourselves with the high temperatures for Tuesday through Saturday.
Examine the figure below, which shows the high temperature line for those five days.
For the high temperature for the next Sunday to be greater than exactly four of the five and less than the remaining one, the temperature must be strictly between the highest and second-highest high temperatures, which are seen to be 78 and 74 degrees, respectively. That is, if we let be the temperature in degrees,
Of the four choices, only 75 falls in this range.
Since we are dealing with the day after the last one shown, and we are comparing that day's high temperature to those of the previous five days, we only need to concern ourselves with the high temperatures for Tuesday through Saturday.
Examine the figure below, which shows the high temperature line for those five days.
For the high temperature for the next Sunday to be greater than exactly four of the five and less than the remaining one, the temperature must be strictly between the highest and second-highest high temperatures, which are seen to be 78 and 74 degrees, respectively. That is, if we let
Of the four choices, only 75 falls in this range.
← Didn't Know|Knew It →
Refer to the above graph, which shows the high and low temperatures for Kingdom City over a one-week period.
Which of the following temperatures occurred at least once on each of the seven days?
Refer to the above graph, which shows the high and low temperatures for Kingdom City over a one-week period.
Which of the following temperatures occurred at least once on each of the seven days?
Tap to reveal answer
The graph is recreated in the figure below, with horizontal lines at the 57, 62, 67, and 72 degree levels.
It can be seen that of the four lines, only the 62 degree line falls between the high temperature and low temperature for each of the seven days. This is the correct choice.
The graph is recreated in the figure below, with horizontal lines at the 57, 62, 67, and 72 degree levels.
It can be seen that of the four lines, only the 62 degree line falls between the high temperature and low temperature for each of the seven days. This is the correct choice.
← Didn't Know|Knew It →
The above figure shows two black quarter-circles inscribed inside a rectangle. If the black region has area 200, what is the area of the white region (nearest tenth)?
The above figure shows two black quarter-circles inscribed inside a rectangle. If the black region has area 200, what is the area of the white region (nearest tenth)?
Tap to reveal answer
If the radius of each quarter-circle is , the black region has area
Set and solve for :
The area of the rectangle, which we will call , is
The area of the white region is the difference of these two areas, or
If the radius of each quarter-circle is
Set
The area of the rectangle, which we will call
The area of the white region is the difference of these two areas, or
← Didn't Know|Knew It →
Refer to the above graph. Which of the following comes closest to the percent of increase in population enjoyed by Jones City between 1900 and 1950?
Refer to the above graph. Which of the following comes closest to the percent of increase in population enjoyed by Jones City between 1900 and 1950?
Tap to reveal answer
In 1900, the population was about 3,500; in 1950, it was about 5,600. A reasonable estimate of the percent of increase would be
so 60% would be the most reasonable choice.
In 1900, the population was about 3,500; in 1950, it was about 5,600. A reasonable estimate of the percent of increase would be
so 60% would be the most reasonable choice.
← Didn't Know|Knew It →
Refer to the above graph, which shows the high and low temperatures for Kingdom City over a one-week period. The temperatures at left are given in degrees Fahrenheit.
Temperatures given in degrees Fahrenheit can be converted to the Celsius scale using the formula
.
Express the lowest temperature of the week in degrees Celsius (nearest whole degree).
Refer to the above graph, which shows the high and low temperatures for Kingdom City over a one-week period. The temperatures at left are given in degrees Fahrenheit.
Temperatures given in degrees Fahrenheit can be converted to the Celsius scale using the formula
Express the lowest temperature of the week in degrees Celsius (nearest whole degree).
Tap to reveal answer
As can be seen below, the lowest temperature for the week was , on Monday.
To convert this to degrees Celsius, set and substitute in the given formula:
degrees Celsius. The closest choice is .
As can be seen below, the lowest temperature for the week was
To convert this to degrees Celsius, set
← Didn't Know|Knew It →
Refer to the above graph, which shows the high and low temperatures for Kingdom City over a one-week period. The temperatures at left are given in degrees Fahrenheit.
Temperatures given in degrees Fahrenheit can be converted to the Celsius scale using the formula
What was the difference, in degrees Celsius, between the highest temperature and the lowest temperature for the week (to the nearest whole degree)?
Tap to reveal answer
As can be seen below, the highest temperature for the week was , on Tuesday; the low temperature, , on Monday.
To convert the former to degrees Celsius, set and substitute in the given formula:
.
To convert the latter, do the same, with .
.
The difference is
, which rounds to .
As can be seen below, the highest temperature for the week was
To convert the former to degrees Celsius, set
To convert the latter, do the same, with
The difference is
← Didn't Know|Knew It →
Refer to the above graph, which shows the high and low temperatures for Kingdom City over a one-week period.
Tim wants to know the high temperature for the Sunday of the next week. He does not have access to that information, but he knows that it was higher than those of exactly four of the five previous days, and lower than that of one of them. Which of the following temperatures could have been the high temperature for that day?
Refer to the above graph, which shows the high and low temperatures for Kingdom City over a one-week period.
Tim wants to know the high temperature for the Sunday of the next week. He does not have access to that information, but he knows that it was higher than those of exactly four of the five previous days, and lower than that of one of them. Which of the following temperatures could have been the high temperature for that day?
Tap to reveal answer
Since we are dealing with the day after the last one shown, and we are comparing that day's high temperature to those of the previous five days, we only need to concern ourselves with the high temperatures for Tuesday through Saturday.
Examine the figure below, which shows the high temperature line for those five days.
For the high temperature for the next Sunday to be greater than exactly four of the five and less than the remaining one, the temperature must be strictly between the highest and second-highest high temperatures, which are seen to be 78 and 74 degrees, respectively. That is, if we let be the temperature in degrees,
Of the four choices, only 75 falls in this range.
Since we are dealing with the day after the last one shown, and we are comparing that day's high temperature to those of the previous five days, we only need to concern ourselves with the high temperatures for Tuesday through Saturday.
Examine the figure below, which shows the high temperature line for those five days.
For the high temperature for the next Sunday to be greater than exactly four of the five and less than the remaining one, the temperature must be strictly between the highest and second-highest high temperatures, which are seen to be 78 and 74 degrees, respectively. That is, if we let
Of the four choices, only 75 falls in this range.
← Didn't Know|Knew It →
The above figure shows two black quarter-circles inscribed inside a rectangle. If the black region has area 200, what is the area of the white region (nearest tenth)?
The above figure shows two black quarter-circles inscribed inside a rectangle. If the black region has area 200, what is the area of the white region (nearest tenth)?
Tap to reveal answer
If the radius of each quarter-circle is , the black region has area
Set and solve for :
The area of the rectangle, which we will call , is
The area of the white region is the difference of these two areas, or
If the radius of each quarter-circle is
Set
The area of the rectangle, which we will call
The area of the white region is the difference of these two areas, or
← Didn't Know|Knew It →
Refer to the above graph. Which of the following comes closest to the percent of increase in population enjoyed by Jones City between 1900 and 1950?
Refer to the above graph. Which of the following comes closest to the percent of increase in population enjoyed by Jones City between 1900 and 1950?
Tap to reveal answer
In 1900, the population was about 3,500; in 1950, it was about 5,600. A reasonable estimate of the percent of increase would be
so 60% would be the most reasonable choice.
In 1900, the population was about 3,500; in 1950, it was about 5,600. A reasonable estimate of the percent of increase would be
so 60% would be the most reasonable choice.
← Didn't Know|Knew It →