SAT Math Help
Help Questions
SAT Math › SAT Math Help
A delivery drone’s distance from its starting point is modeled by $d(t)=|t-6|+2$, where $t$ is minutes after launch. What is $d(10)$?
$2$
$6$
$4$
$12$
Explanation
We need to find d(10) for the absolute value function d(t) = |t-6| + 2. This models a drone's distance, with the absolute value creating a V-shaped path. Substituting t = 10: d(10) = |10-6| + 2 = |4| + 2 = 4 + 2 = 6. The absolute value |10-6| = |4| = 4 represents the time difference from t = 6, and adding 2 gives the total distance. The vertex of this V-shaped function occurs at t = 6 where the distance is minimized at d(6) = |6-6| + 2 = 0 + 2 = 2. For absolute value functions, always evaluate the expression inside first, then take the absolute value.
For the function $f(x)=|2x-7|$, what is the value of $f(1)$?
$5$
$-5$
$-9$
$9$
Explanation
We need to find f(1) for the absolute value function f(x) = |2x - 7|. This is an absolute value function, which creates a V-shaped graph. To find f(1), substitute x = 1: f(1) = |2(1) - 7| = |2 - 7| = |-5| = 5. The absolute value operation takes the distance from zero, so |-5| = 5. A common error is forgetting to apply the absolute value and leaving the answer as -5. When working with absolute value functions, always remember the final step of taking the positive value.
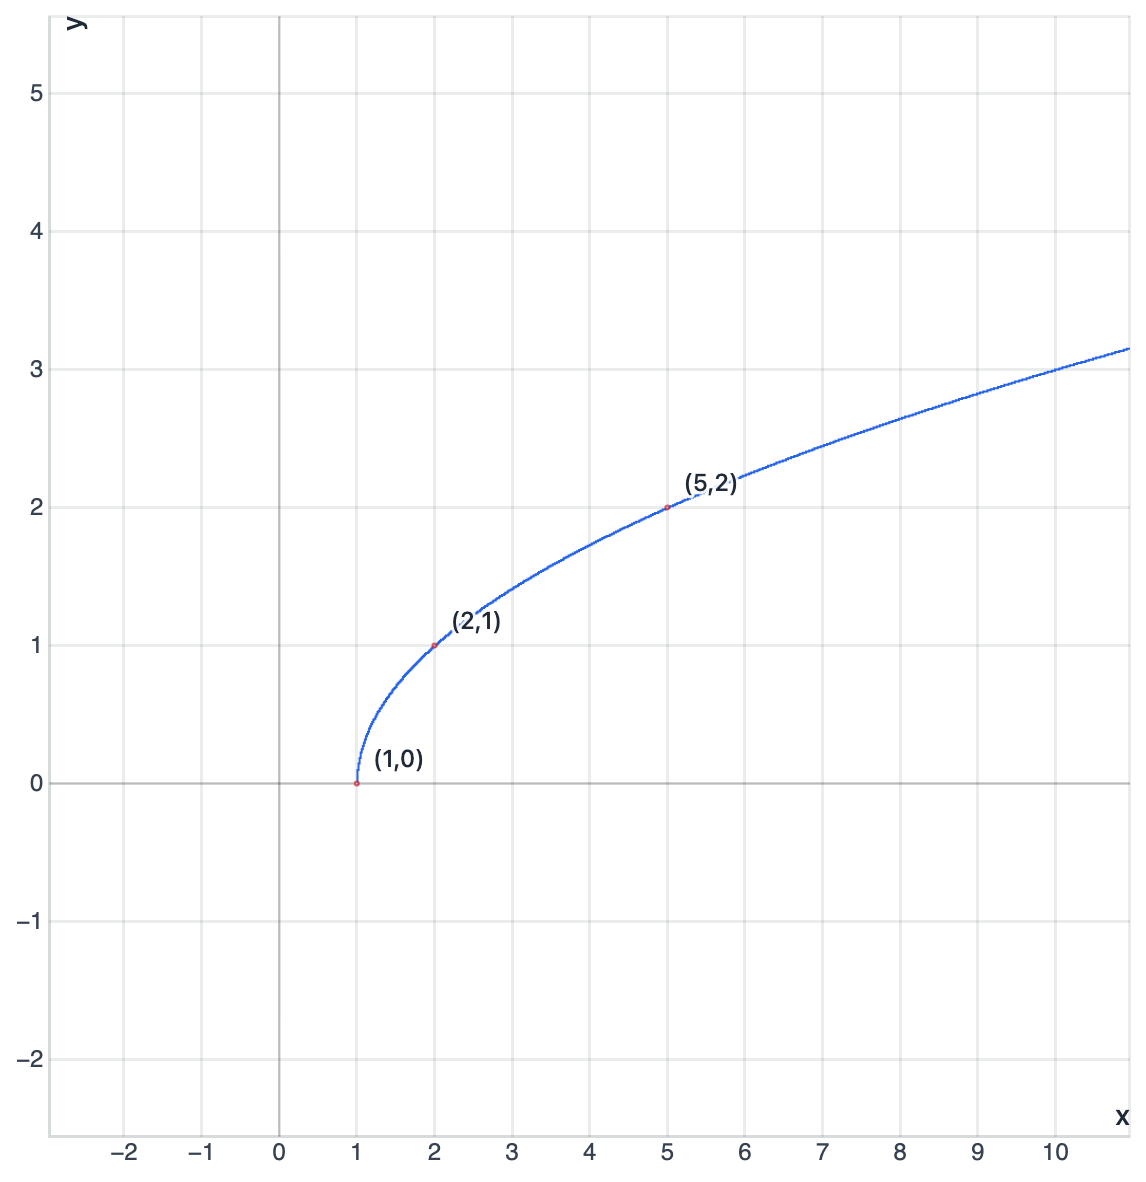
If $r(x)=\sqrt{9-2x}$ is real-valued, what is the largest possible value of $x$ in its domain?
$18$
$\dfrac{9}{2}$
$-\dfrac{9}{2}$
$9$
Explanation
We need to find the largest x-value in the domain of r(x) = √(9-2x). This is a square root function requiring 9 - 2x ≥ 0 for real values. Solving the inequality: 9 - 2x ≥ 0; 9 ≥ 2x; 9/2 ≥ x; x ≤ 9/2. The largest possible x-value is 9/2. We can verify: when x = 9/2, we get 9 - 2(9/2) = 9 - 9 = 0, and √0 = 0 is defined. Common errors include solving the inequality incorrectly or forgetting to flip the inequality sign when dividing by negative numbers (though we divided by positive 2 here).
The function $p(x)=\dfrac{4}{x}+1$ is defined for real $x$ where possible. What is the range of $p(x)$?
$y\ne 1$
$y\ge 1$
$y\ne 0$
$y\le 1$
Explanation
We need to find the range of p(x) = 4/x + 1, a rational function. The term 4/x can take any value except 0 (since x ≠ 0 for the function to be defined). As x approaches 0 from the positive side, 4/x → +∞; as x approaches 0 from the negative side, 4/x → -∞; as x → ±∞, 4/x → 0. Therefore, 4/x can be any real number except 0, and p(x) = 4/x + 1 can be any real number except 1. The range is y ≠ 1. The horizontal asymptote at y = 1 confirms this. For rational functions of the form a/x + k, the range excludes y = k.
A coordinate plane shows the graph of $y=\sqrt{x-1}$. What is the domain of this function as shown (real outputs only)?
$(-\infty,\infty)$
$[1,\infty)$
$(-\infty,1]$
$(1,\infty)$
Explanation
This question asks for the domain of y = √(x-1) when considering only real outputs. This is a square root function, which requires the expression under the radical to be non-negative. Setting up the inequality: x - 1 ≥ 0, which gives x ≥ 1. The domain is all x-values greater than or equal to 1, written as [1,∞). The square bracket indicates that x = 1 is included since √(1-1) = √0 = 0 is defined. A common error is using parentheses instead of brackets, which would exclude the endpoint. For radical functions with even roots, always use ≥ (not >) for the domain restriction.
A coordinate plane shows a parabola opening upward with vertex at $(1,-4)$ and passing through $(0,-3)$. Which equation matches the graph?
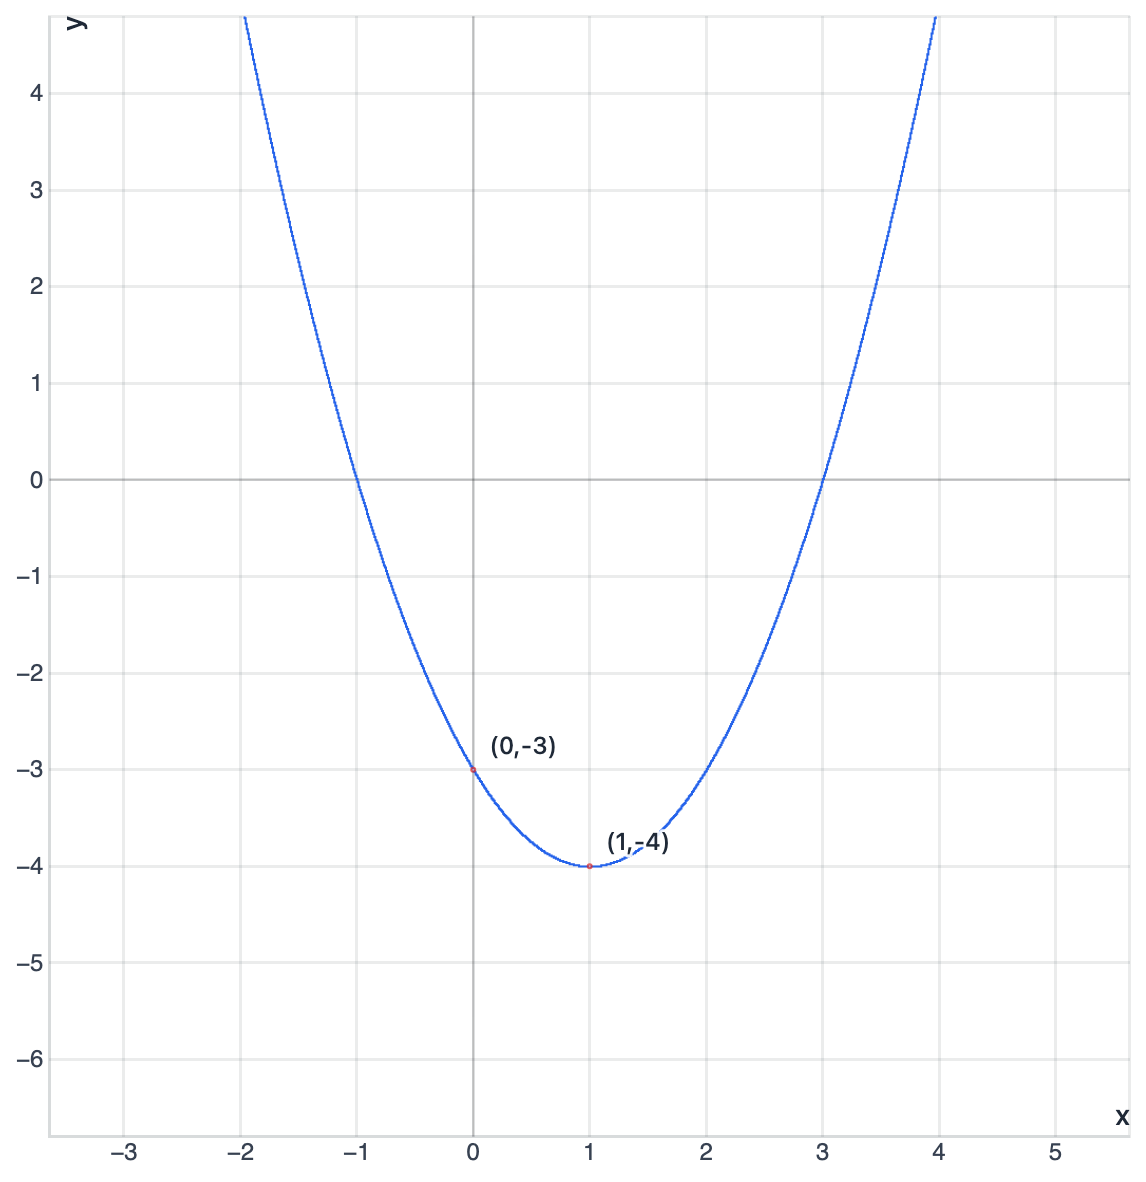
$y=(x+1)^2-4$
$y=(x-1)^2-4$
$y=|x-1|-4$
$y=(x-1)^2+4$
Explanation
We need to match an equation to a parabola with vertex at (1,-4) passing through (0,-3). This is a quadratic function in vertex form: y = a(x-h)² + k where (h,k) = (1,-4). So y = a(x-1)² - 4. To find a, use the point (0,-3): -3 = a(0-1)² - 4; -3 = a(1) - 4; -3 = a - 4; a = 1. Therefore, y = (x-1)² - 4. We can verify: vertex is at (1,-4) ✓, and when x = 0: y = (0-1)² - 4 = 1 - 4 = -3 ✓. The parabola opens upward since a = 1 > 0. When given vertex and another point, use vertex form to find the equation.
A coordinate plane shows a curve that crosses the $y$-axis at $(0,2)$ and passes through $(1,6)$ and $(2,18)$. Which equation best represents the curve?
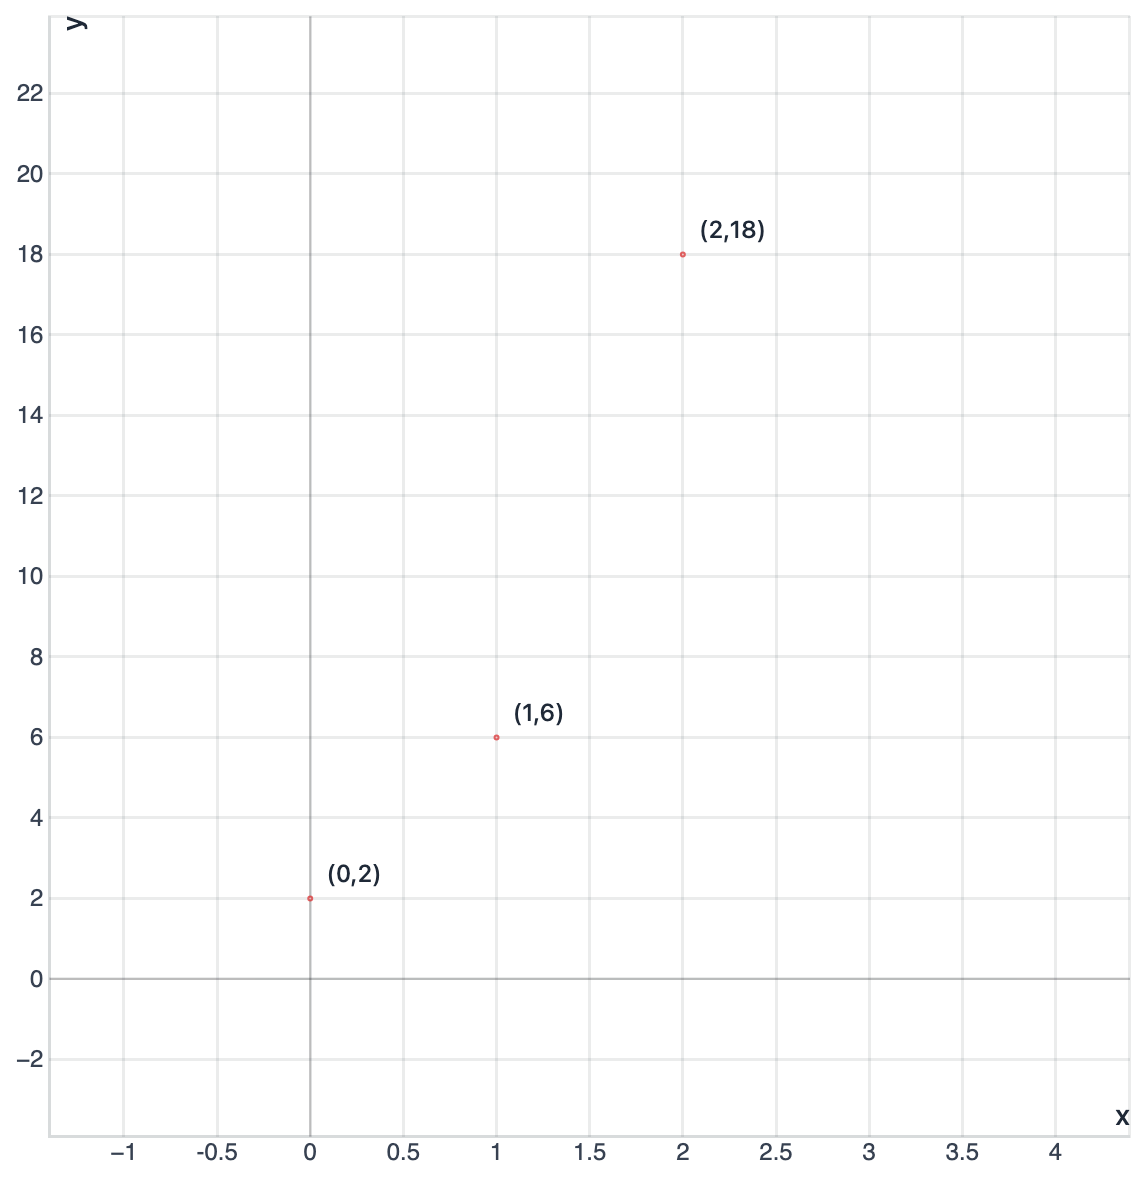
$y=3x+2$
$y=2x+2$
$y=2\cdot 2^x$
$y=2\cdot 3^x$
Explanation
We need to identify which equation matches a curve passing through (0,2), (1,6), and (2,18). This is clearly an exponential function since the y-values are multiplying by a constant factor: from 2 to 6 is ×3, and from 6 to 18 is also ×3. Testing y = $2·3^x$: at x = 0, y = $2·3^0$ = 2·1 = 2 ✓; at x = 1, y = $2·3^1$ = 2·3 = 6 ✓; at x = 2, y = $2·3^2$ = 2·9 = 18 ✓. The pattern of multiplying by 3 each time confirms exponential growth. Linear functions would add the same amount each time, not multiply. When data shows constant multiplication between successive y-values, it indicates an exponential function.
A coordinate plane shows an exponential curve that passes through $(0,8)$ and decreases to the right, passing near $(1,4)$ and $(2,2)$. Which equation best matches the graph?
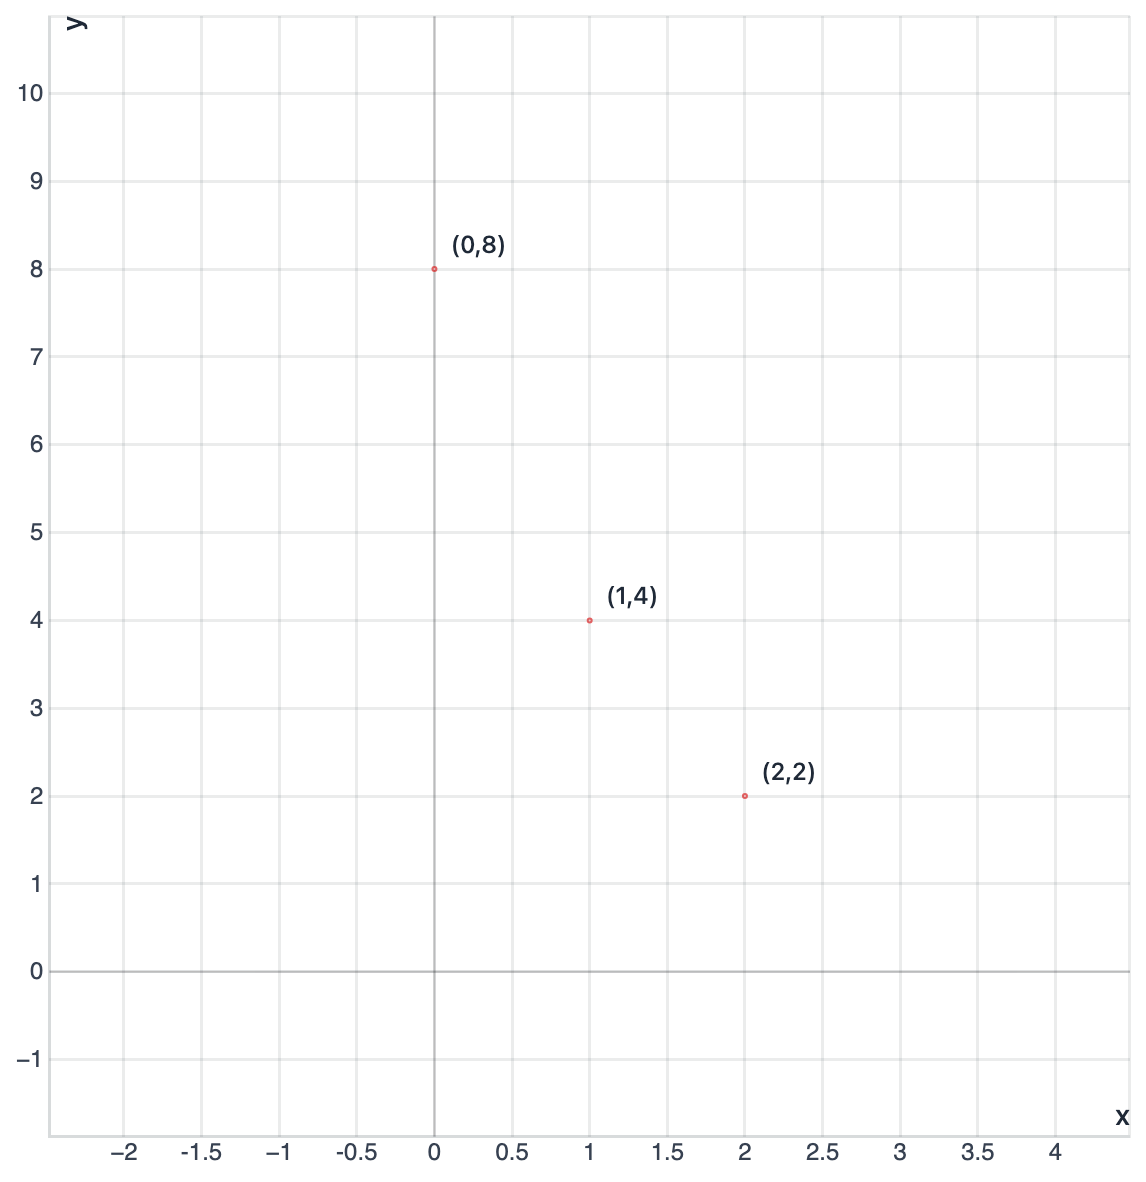
$y=4\left(\dfrac12\right)^x$
$y=8\left(\dfrac12\right)^x$
$y=8(2)^x$
$y=8-x$
Explanation
We need to identify an exponential curve passing through (0,8), (1,4), and (2,2). This is exponential decay since values are decreasing. From 8 to 4 is ×1/2, and from 4 to 2 is also ×1/2, confirming constant ratio. Testing y = $8(1/2)^x$: at x = 0, y = $8(1/2)^0$ = 8(1) = 8 ✓; at x = 1, y = $8(1/2)^1$ = 8(1/2) = 4 ✓; at x = 2, y = $8(1/2)^2$ = 8(1/4) = 2 ✓. The decay factor of 1/2 means the function value halves with each unit increase in x. Exponential decay has base between 0 and 1. When consecutive y-values show constant ratios less than 1, it indicates exponential decay.
A savings account follows $A(t)=5000(0.92)^t$, where $t$ is years. Approximately what percent of the balance remains each year?
0.92%
8%
92%
108%
Explanation
This question asks what percent of the balance remains each year for A(t) = $5000(0.92)^t$. This is an exponential decay function where the base 0.92 represents the decay factor. The decay factor 0.92 means that each year, the account retains 92% of its previous year's balance (since 0.92 = 92/100 = 92%). This represents an 8% decrease each year. The common error would be thinking 0.92 means 0.92% or confusing the retention rate with the decay rate. When interpreting exponential decay factors, multiply by 100 to get the percentage that remains.
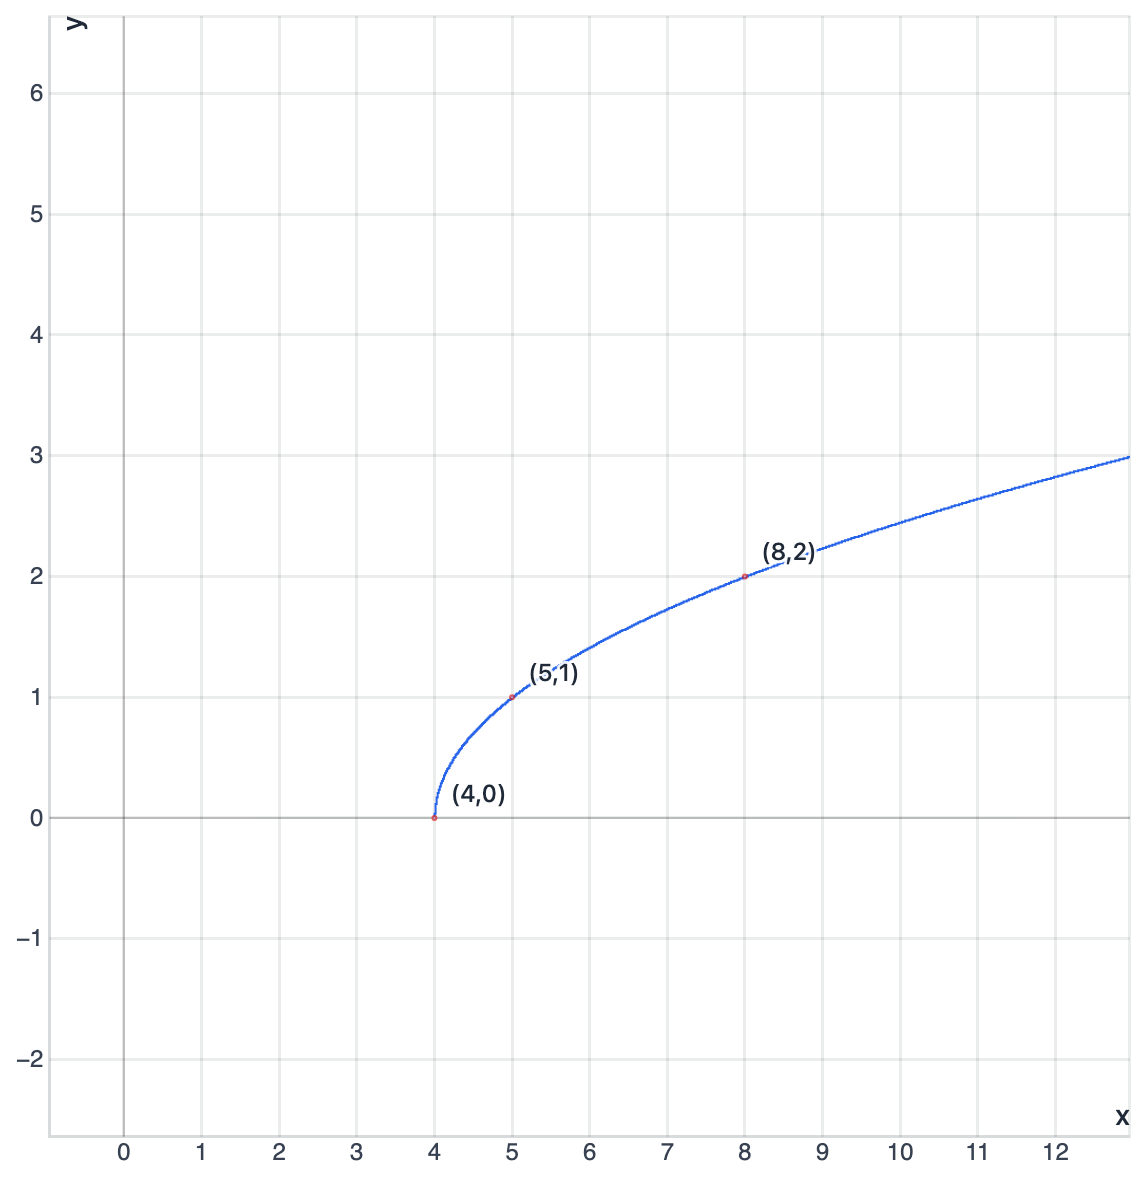
A coordinate plane shows a curve starting at $(4,0)$ and increasing to the right, passing through $(5,1)$ and $(8,2)$. Which equation best matches the graph?
$y=(x-4)^2$
$y=\sqrt{x-4}$
$y=\dfrac{1}{x-4}$
$y=|x-4|$
Explanation
We need to match an equation to a curve starting at (4,0) and passing through (5,1) and (8,2). This is a square root function since it starts at a point and increases at a decreasing rate. Testing y = √(x-4): at x = 4, y = √(4-4) = √0 = 0 ✓; at x = 5, y = √(5-4) = √1 = 1 ✓; at x = 8, y = √(8-4) = √4 = 2 ✓. The function starts at x = 4 because that's where the expression under the radical becomes zero. Square root functions have a starting point and increase gradually. The characteristic shape and the fact it starts at (4,0) rather than continuing left confirms this is a radical function.