0%
0 / 25 answered
Practice Test 10
•25 QuestionsQuestion
1 / 25
Q1
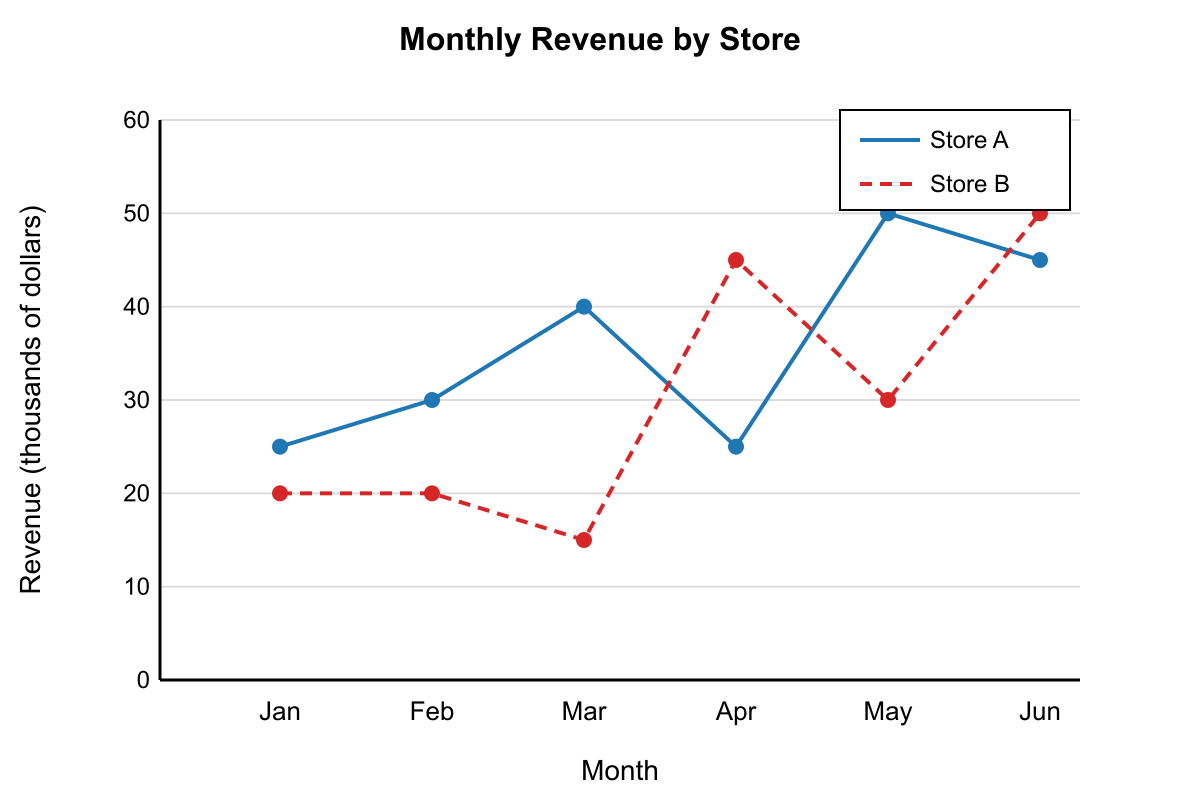
Refer to the double-line graph shown, which displays monthly revenue (in thousands of dollars) for Store A and Store B from January through June. During which month was the percent difference between the stores' revenues the greatest (relative to the smaller value)?
Refer to the double-line graph shown, which displays monthly revenue (in thousands of dollars) for Store A and Store B from January through June. During which month was the percent difference between the stores' revenues the greatest (relative to the smaller value)?