PSAT Math Flashcards: Scatter Plots

Study Scatter Plots in PSAT Math with focused flashcards that help you recognize the idea, recall the key rule, and apply it in practice-style prompts.

PSAT Math

Scatter Plots

0 mastered0 still learning

0% Complete

QUESTION
1/ 198

What is the slope-intercept form typically used for a linear model on a scatter plot?

Tap card or press Space to flip

ANSWER

y=mx+by = mx + b. Standard linear equation form where mm is slope and bb is y-intercept.

How well did you know it?

Card 1 / 198

What this deck covers

This deck focuses on Scatter Plots, giving you a quick way to review the definitions, rules, and examples that matter most for PSAT Math.

How to use these flashcards

Work through these flashcards in short sessions. Try to answer each prompt before flipping the card, then revisit any cards you miss until the explanation feels automatic.

All flashcards

Flashcard 1: What is the slope-intercept form typically used for a linear model on a scatter plot?

Answer: y=mx+by = mx + b. Standard linear equation form where mm is slope and bb is y-intercept.

Flashcard 2: Which prediction method is used when x=12x=12 but the data only cover xx from 33 to 1010?

Answer: Extrapolation. x=12x=12 exceeds the data range of 33 to 1010.

Flashcard 3: What does the yy-intercept bb represent in a model y=mx+by=mx+b?

Answer: The predicted yy value when x=0x=0. It's where the line crosses the yy-axis.

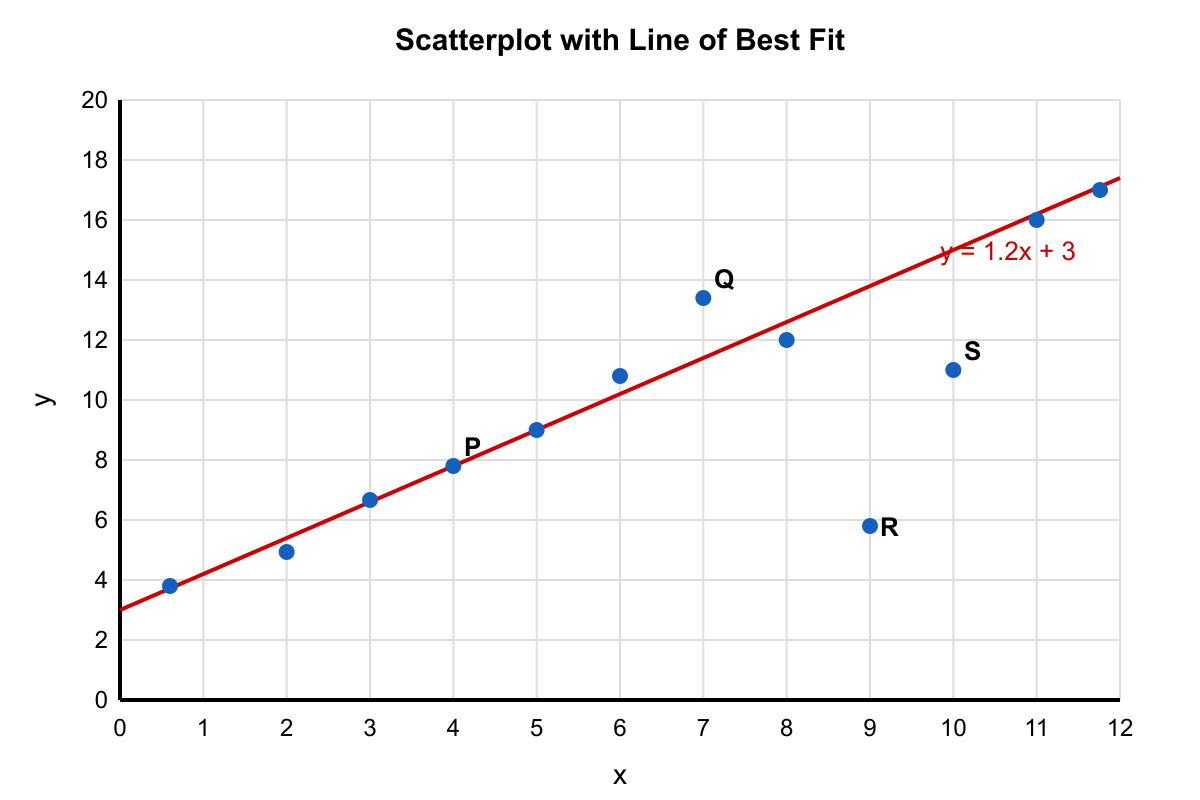
Flashcard 4: What is a line of best fit in a scatter plot used to do?

Answer: Model the trend and predict yy from xx. Line minimizes distances to all data points.

Flashcard 5: What does a negative association in a scatter plot mean as xx increases?

Answer: yy tends to decrease as xx increases. Points fall from left to right, showing inverse relationship.

Flashcard 6: What is interpolation when using a scatter plot model?

Answer: Predicting within the range of observed xx-values. Uses the model within the data's domain.

Flashcard 7: What does no association in a scatter plot mean about the relationship of xx and yy?

Answer: There is no clear trend between xx and yy. Points are scattered randomly without pattern.

Flashcard 8: Using y=x+7y=-x+7, what is the predicted yy-value when x=9x=9?

Answer: 2-2. Substitute: y=9+7=2y=-9+7=-2.

Flashcard 9: Identify the association type if points trend upward from left to right.

Answer: Positive association. Rising pattern indicates variables increase together.

Flashcard 10: What does "no association" mean in a scatter plot?

Answer: Changes in xx do not show a clear pattern in yy. No predictable relationship exists between the variables.

Flashcard 11: What is a scatter plot used to display about two quantitative variables?

Answer: A set of paired data points (x,y)(x, y) showing their relationship. Visualizes how two variables relate by plotting coordinate pairs.

Flashcard 12: Identify the correlation type if points form a random cloud with no trend.

Answer: No correlation. Random scatter shows variables are unrelated.

Flashcard 13: What does it mean if a scatter plot shows no correlation?

Answer: There is no clear trend relating xx to yy. Points are scattered randomly without a linear pattern.

Flashcard 14: Identify the correlation type if points trend downward from left to right.

Answer: Negative correlation. Downward trend shows inverse relationship.

Flashcard 15: What does it mean if a scatter plot shows little or no association?

Answer: There is no clear trend between xx and yy. Variables change independently of each other.

Flashcard 16: Identify the correlation type if points trend upward from left to right.

Answer: Positive correlation. Upward trend indicates variables increase together.

Flashcard 17: A best-fit line predicts y=20y=20 at x=5x=5. What is the residual if the actual value is y=23y=23?

Answer: 33. Residual = actual - predicted = 232023 - 20.

Flashcard 18: What does a positive residual indicate about a point relative to the best-fit line?

Answer: The point is above the line; actual yy is greater than predicted. Model underestimated the actual value.

Flashcard 19: What does the yy-intercept of a best-fit line represent in context?

Answer: The predicted value of yy when x=0x=0. Shows the starting value when the independent variable is zero.

Flashcard 20: What does a negative association mean in a scatter plot?

Answer: As xx increases, yy tends to decrease. Points trend downward from left to right on the graph.

Flashcard 21: Using y=2x+5, what is the predicted value y when x=7x=7?

Answer: 1919. Substitute: y=2(7)+5=14+5=19y=2(7)+5=14+5=19.

Flashcard 22: What is a residual for a data point in a scatter plot model?

Answer: Residual == actual yy minus predicted y. Measures prediction error for each point.

Flashcard 23: What does it mean if points lie close to a straight line in a scatter plot?

Answer: The association is strong (little scatter around a line). Points cluster tightly around a linear pattern.

Flashcard 24: For point (4,18)(4,18) and prediction y^=15\hat{y}=15, what is the residual yy^y-\hat{y}?

Answer: 33. Residual = actual - predicted = 1815=318-15=3.

Flashcard 25: Identify the residual for observed (x,y)=(3,11)(x,y)=(3,11) with prediction y=2x+4 y=2x+4.

Answer: 11. Residual = observed - predicted = 11(2(3)+4)=1110=111-(2(3)+4)=11-10=1.

Flashcard 26: Find the equation of the line with slope 33 passing through (1,2)(1,2).

Answer: y=3x1y=3x-1. Use point-slope form: y2=3(x1)y-2=3(x-1), then simplify.

Flashcard 27: Find the equation of the line through (1,4)(1,4) with slope m=3m=3 in y=mx+by=mx+b form.

Answer: y=3x+1y=3x+1. Substitute (1,4)(1,4): 4=3(1)+b4=3(1)+b, so b=1b=1.

Flashcard 28: What is the line of best fit in a scatter plot?

Answer: A line that models the overall linear trend of the data. Best fit lines minimize distances to all data points.

Flashcard 29: What does correlation describe in a scatter plot?

Answer: The direction and strength of a linear relationship. Measured by correlation coefficient rr from 1-1 to 11.

Flashcard 30: Using y=mx+by=mx+b, find mm for a best-fit line passing through (2,5)(2,5) and (6,13)(6,13).

Answer: 22. Slope m=13562=84=2m=\frac{13-5}{6-2}=\frac{8}{4}=2.

Flashcard 31: Using y=2x+1y=2x+1, find the residual for observed point (4,12)(4,12).

Answer: 33. Residual = observed - predicted = 12[2(4)+1]=129=312-[2(4)+1]=12-9=3.

Flashcard 32: Identify the equation of the line with slope 33 passing through (1,4)(1,4) in slope-intercept form.

Answer: y=3x+1y=3x+1. Use point-slope: y4=3(x1)y-4=3(x-1), simplify to y=3x+1y=3x+1.

Flashcard 33: What does a negative residual mean for a point relative to a best-fit line?

Answer: The point is below the line: actual y < y. Model overestimated the actual value.

Flashcard 34: What is interpolation when using a scatter plot or best-fit line?

Answer: Predicting yy for an xx value within the observed data range. Uses existing data patterns to estimate between known values.

Flashcard 35: What does it mean if a scatter plot shows a strong linear association?

Answer: Points cluster closely around a straight line. Strong association means little scatter from the linear pattern.

Flashcard 36: What does it mean if a scatter plot shows a weak linear association?

Answer: Points are widely scattered around a general linear trend. Weak association shows more scatter despite a linear trend.

Flashcard 37: What is the meaning of the yy-intercept bb in a best-fit line y=mx+by=mx+b?

Answer: The predicted value of yy when x=0x=0. The yy-intercept is where the line crosses the yy-axis.

Flashcard 38: Identify the association type: points trend upward from left to right.

Answer: Positive association. Rising pattern indicates variables increase together.

Flashcard 39: What is the equation of the line through (0,4)(0,4) and (2,10)(2,10) in the form y=mx+by=mx+b?

Answer: y=3x+4y=3x+4. Slope is rac{10-4}{2-0}=3, y-intercept is 44.

Flashcard 40: Find the residual if actual y=25y=25 and predicted y=19.

Answer: Residual =6=6. Subtract predicted from actual: 2519=625-19=6.

Flashcard 41: Find the predicted value if the best-fit line is y=2x+3y=2x+3 and x=4x=4.

Answer: 1111. Substitute: y=2(4)+3=8+3=11y=2(4)+3=8+3=11.

Flashcard 42: Find the residual if the observed value is y=18y=18 and the predicted value is y=15.

Answer: 33. Calculate 1815=318-15=3.

Flashcard 43: What does it mean if points are tightly clustered around the best-fit line?

Answer: The linear association is strong. Points have little vertical distance from the line.

Flashcard 44: What does a positive association in a scatter plot mean as xx increases?

Answer: yy tends to increase as xx increases. Points trend upward from left to right in positive associations.

Flashcard 45: Using y=2x1y=2x-1 as a best-fit line, what is the predicted yy when x=5x=5?

Answer: 99. Substitute: y=2(5)1=101=9y = 2(5) - 1 = 10 - 1 = 9.

Flashcard 46: Identify whether the point (5,2)(5,2) is above or below the line y=0.5x+1y=0.5x+1.

Answer: Below. At x=5x=5: y=0.5(5)+1=3.5y=0.5(5)+1=3.5, so (5,2)(5,2) is below the line.

Flashcard 47: What does extrapolation mean when using a line of best fit?

Answer: Predicting outside the range of the observed xx-values. Making predictions beyond the data's domain is less reliable.

Flashcard 48: What is the predicted yy if the best-fit line is y=2x+3y=2x+3 and x=4x=4?

Answer: 1111. Substitute x=4x=4: y=2(4)+3=8+3=11y=2(4)+3=8+3=11.

Flashcard 49: Identify the slope of the line of best fit given by y=- rac{3}{2}x+4.

Answer: - rac{3}{2}. The coefficient of xx in slope-intercept form.

Flashcard 50: What is a scatter plot used to display about two quantitative variables xx and yy?

Answer: A set of plotted ordered pairs (x,y)(x,y) showing association. Scatter plots visualize relationships between two quantitative variables.

Flashcard 51: What does a negative association in a scatter plot mean as xx increases?

Answer: yy tends to decrease as xx increases. Points trend downward from left to right.

Flashcard 52: What is the slope meaning in a best-fit line y=mx+by=mx+b on a scatter plot?

Answer: The predicted change in yy for a 11-unit increase in xx. Slope shows rate of change between variables.

Flashcard 53: What does the term "positive association" mean in a scatter plot?

Answer: As xx increases, yy tends to increase. Both variables move in the same direction together.

Flashcard 54: Identify the association: points trend downward from left to right on a scatter plot.

Answer: Negative association. Falling pattern shows inverse relationship.

Flashcard 55: For the model y=0.5x+10y=-0.5x+10, what is the predicted change in yy when xx increases by 44?

Answer: y y changes by 2-2. Change is (0.5)(4)=2(-0.5)(4)=-2.

Flashcard 56: Identify the predicted yy when the model is y=2x+3y = 2x + 3 and x=4x = 4.

Answer: 1111. Substitute: y=2(4)+3=8+3=11y = 2(4) + 3 = 8 + 3 = 11.

Flashcard 57: What is a residual for a point relative to a line of best fit?

Answer: extresidual=extobservedyextpredictedy ext{residual}= ext{observed }y- ext{predicted }y. Residuals measure vertical distance from points to the line.

Flashcard 58: Using y=3x-2, find the actual yy if the residual is 5-5 when x=4x=4.

Answer: Actual y=5y=5. Predicted y=3(4)2=10y=3(4)-2=10; actual =10+(5)=5=10+(-5)=5.

Flashcard 59: What does a positive residual mean for a point relative to a best-fit line?

Answer: The point is above the line: actual y > y. Model underestimated the actual value.

Flashcard 60: What does correlation describe for a scatter plot?

Answer: The direction and strength of a linear relationship. Correlation measures linear relationships only.

Flashcard 61: Identify the direction of association if the best-fit line slopes downward left to right.

Answer: Negative association. Slope is negative when line falls left to right.

Flashcard 62: Identify the association: points form a random cloud with no clear trend.

Answer: No association (no clear trend). Points are scattered without a linear pattern.

Flashcard 63: What is a cluster in a scatter plot?

Answer: A group of points concentrated in one region of the plot. Data points grouped together in specific area.

Flashcard 64: What is the meaning of r=1r=1 for a set of points in a scatter plot?

Answer: Perfect positive linear correlation. All points lie exactly on a line with positive slope.

Flashcard 65: What is the meaning of r=0r=0 for a set of points in a scatter plot?

Answer: No linear correlation. Points show no linear pattern.

Flashcard 66: What does the slope mm represent in a best-fit line y=mx+by=mx+b?

Answer: The predicted change in yy for each 11-unit increase in xx. Slope shows rate of change between variables.

Flashcard 67: Which option describes positive correlation in a scatter plot?

Answer: As xx increases, yy tends to increase. Points trend upward from left to right on the graph.

Flashcard 68: Identify the association type for points that trend downward from left to right.

Answer: Negative association. Downward trend indicates yy decreases as xx increases.

Flashcard 69: What is an interpolated prediction on a scatter plot?

Answer: A prediction for an xx value within the data range. Uses existing data range for reliable estimates.

Flashcard 70: Which prediction is generally less reliable: interpolation or extrapolation?

Answer: Extrapolation. Assumes pattern continues beyond observed data.

Flashcard 71: For point (5,14)(5,14) and model y=2x+3y=2x+3, what is the residual?

Answer: 11. Actual 1414 minus predicted 2(5)+3=132(5)+3=13.

Flashcard 72: Which statement best describes why extrapolation from a scatter plot can be unreliable?

Answer: The linear trend may not continue beyond the observed data range. Patterns often change outside observed ranges.

Flashcard 73: Which prediction method is used when x=7x=7 and the data cover xx from 33 to 1010?

Answer: Interpolation. x=7x=7 falls within the data range of 33 to 1010.

Flashcard 74: Identify the direction of association if the best-fit line slopes upward left to right.

Answer: Positive association. Slope is positive when line rises left to right.

Flashcard 75: In y=mx+by = mx + b, what does the intercept bb represent in context of a scatter plot?

Answer: The predicted value of yy when x=0x = 0. Y-intercept is where the line crosses the y-axis.

Flashcard 76: What is the meaning of r=1r=-1 for a set of points in a scatter plot?

Answer: Perfect negative linear correlation. All points lie exactly on a line with negative slope.

Flashcard 77: What does the yy-intercept bb of a best-fit line represent in context?

Answer: The predicted yy value when x=0x=0. The yy-intercept is where the line crosses the yy-axis.

Flashcard 78: In y=mx+by = mx + b, what does the slope mm represent in context of a scatter plot?

Answer: The predicted change in yy for each 11-unit increase in xx. Slope shows rate of change between variables.

Flashcard 79: What does a positive residual mean for a point relative to the best-fit line?

Answer: The point is above the line: extobservedy>extpredictedy ext{observed }y> ext{predicted }y. Positive residuals mean the actual value exceeds prediction.

Flashcard 80: Find the residual if the observed value is y=18y=18 and the line predicts ar{y}=20.

Answer: 2-2. Calculate 1820=218-20=-2 using the residual formula.

Flashcard 81: Identify whether extrapolation or interpolation is used when predicting at an xx outside the data range.

Answer: Extrapolation. Predicting beyond known data range is less reliable.

Flashcard 82: What does a positive association in a scatter plot mean about xx and yy?

Answer: As xx increases, yy tends to increase. Points trend upward from left to right.

Flashcard 83: What is the predicted yy if the best-fit line is y=3x+10y=-3x+10 and x=2x=2?

Answer: 44. Substitute x=2x=2: y=3(2)+10=6+10=4y=-3(2)+10=-6+10=4.

Flashcard 84: In y=mx+by=mx+b, what does the intercept bb represent in a scatter plot context?

Answer: The predicted value of yy when x=0x=0. Y-intercept is where the line crosses the y-axis.

Flashcard 85: Find the residual if the observed value is y=12y=12 and the predicted value is y=17.

Answer: 5-5. Calculate 1217=512-17=-5.

Flashcard 86: If a best-fit line has slope m=1.2m=-1.2, what is the predicted change in yy when xx increases by 55?

Answer: 6-6. Change = slope × change in xx = 1.2×5=6-1.2×5=-6.

Flashcard 87: Identify the residual when the observed point is (3,12)(3, 12) and the model predicts y = 10.

Answer: 22. Residual = observed - predicted = 1210=212 - 10 = 2.

Flashcard 88: Identify the predicted yy when the model is y=3x+10y = -3x + 10 and x=2x = 2.

Answer: 44. Substitute: y=3(2)+10=6+10=4y = -3(2) + 10 = -6 + 10 = 4.

Flashcard 89: What does a negative association in a scatter plot mean as xx increases?

Answer: yy tends to decrease as xx increases. Points trend downward from left to right in negative associations.

Flashcard 90: A best-fit line has slope 0.5-0.5. What is the predicted change in yy if xx increases by 44?

Answer: 2-2. Change in y=y = slope imes imes change in x=0.5imes4x = -0.5 imes 4.

Flashcard 91: Identify the association type: points trend downward from left to right.

Answer: Negative association. Falling pattern shows one variable decreases as other increases.

Flashcard 92: Identify the correlation type if points form a random cloud with no upward or downward trend.

Answer: No correlation. No linear relationship exists.

Flashcard 93: Using y=2x+3y=2x+3, what is the predicted yy when x=4x=4?

Answer: 1111. Substitute: y=2(4)+3=8+3=11y = 2(4) + 3 = 8 + 3 = 11.

Flashcard 94: What does a negative association in a scatter plot mean about xx and yy?

Answer: As xx increases, yy tends to decrease. Points trend downward from left to right.

Flashcard 95: If a residual is positive, is the point above or below the line of best fit?

Answer: Above the line. Positive residual means observed value exceeds predicted.

Flashcard 96: What is the point-slope form of a line used with a best-fit slope mm through (x1,y1)(x_1,y_1)?

Answer: yy1=m(xx1)y-y_1=m(x-x_1). Rearranges to find the line equation from a point and slope.

Flashcard 97: Using the model y=3x+12y=-3x+12, what is the predicted yy when x=4x=4?

Answer: 00. Substitute: y=3(4)+12=12+12=0y=-3(4)+12=-12+12=0.

Flashcard 98: A best-fit line predicts y=50y=50 at x=10x=10. What is the residual if the actual value is y=44y=44?

Answer: 6-6. Residual = actual - predicted = 445044 - 50.

Flashcard 99: What is a scatter plot?

Answer: A graph of paired data (x,y)(x,y) as points on a coordinate plane. Shows relationships between two variables visually.

Flashcard 100: What is a scatter plot used to display about two quantitative variables xx and yy?

Answer: The relationship between paired data points (x,y)(x,y). Scatter plots visualize how two variables relate to each other.