Graphs and Inverses of Trigonometric Functions
Help Questions
Pre-Calculus › Graphs and Inverses of Trigonometric Functions
What is the period of this sine graph?


Explanation
The graph has 3 waves between 0 and 


What is the period of this sine graph?
Explanation
The graph has 3 waves between 0 and
What is the period of this sine graph?
Explanation
The graph has 3 waves between 0 and
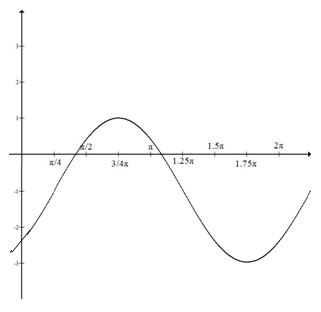
Which equation would produce this sine graph?
-1")
-1")
")
-1")
-3")
Explanation
The graph has an amplitude of 2 but has been shifted down 1:
In terms of the equation, this puts a 2 in front of sin, and -1 at the end.
This makes it easier to see that the graph starts \[is at 0\] where 
The phase shift is 

Which equation would produce this sine graph?
Explanation
The graph has an amplitude of 2 but has been shifted down 1:
In terms of the equation, this puts a 2 in front of sin, and -1 at the end.
This makes it easier to see that the graph starts \[is at 0\] where
The phase shift is
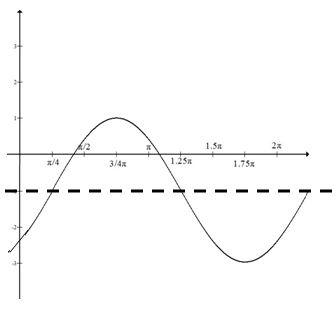
Which equation would produce this sine graph?
Explanation
The graph has an amplitude of 2 but has been shifted down 1:
In terms of the equation, this puts a 2 in front of sin, and -1 at the end.
This makes it easier to see that the graph starts \[is at 0\] where
The phase shift is
Which of the given functions has the greatest amplitude?
")
")
")
")
")
Explanation
The amplitude of a function is the amount by which the graph of the function travels above and below its midline. When graphing a sine function, the value of the amplitude is equivalent to the value of the coefficient of the sine. Similarly, the coefficient associated with the x-value is related to the function's period. The largest coefficient associated with the sine in the provided functions is 2; therefore the correct answer is ")
The amplitude is dictated by the coefficient of the trigonometric function. In this case, all of the other functions have a coefficient of one or one-half.
Write the equation for a sine graph with a maximum at ")
")
 + 1")
 - 1")
) + 1")
")
 + 1")
Explanation
To write this equation, it is helpful to sketch a graph:
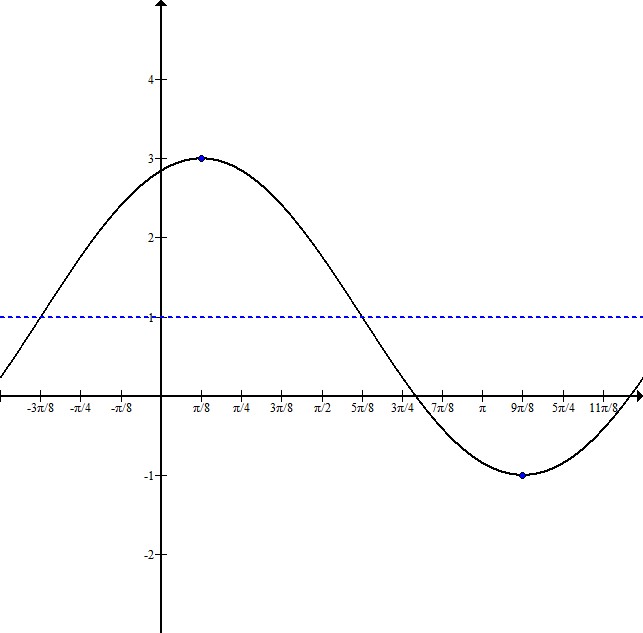
Indicating the maximum and minimum points, we can see that this graph has been shifted up 1, and it has an amplitude of 2.
The distance from the maximum to the minimum point is half the wavelength. In this case, the wavelength is 

This sketch shows that the graph starts to the left of the y-axis. To figure out exactly where, subtract 


Our equation will be in the form ) + k")
This graph has an equation of
 + 1")
Write the equation for a sine graph with a maximum at
Explanation
To write this equation, it is helpful to sketch a graph:
Indicating the maximum and minimum points, we can see that this graph has been shifted up 1, and it has an amplitude of 2.
The distance from the maximum to the minimum point is half the wavelength. In this case, the wavelength is
This sketch shows that the graph starts to the left of the y-axis. To figure out exactly where, subtract
Our equation will be in the form
This graph has an equation of