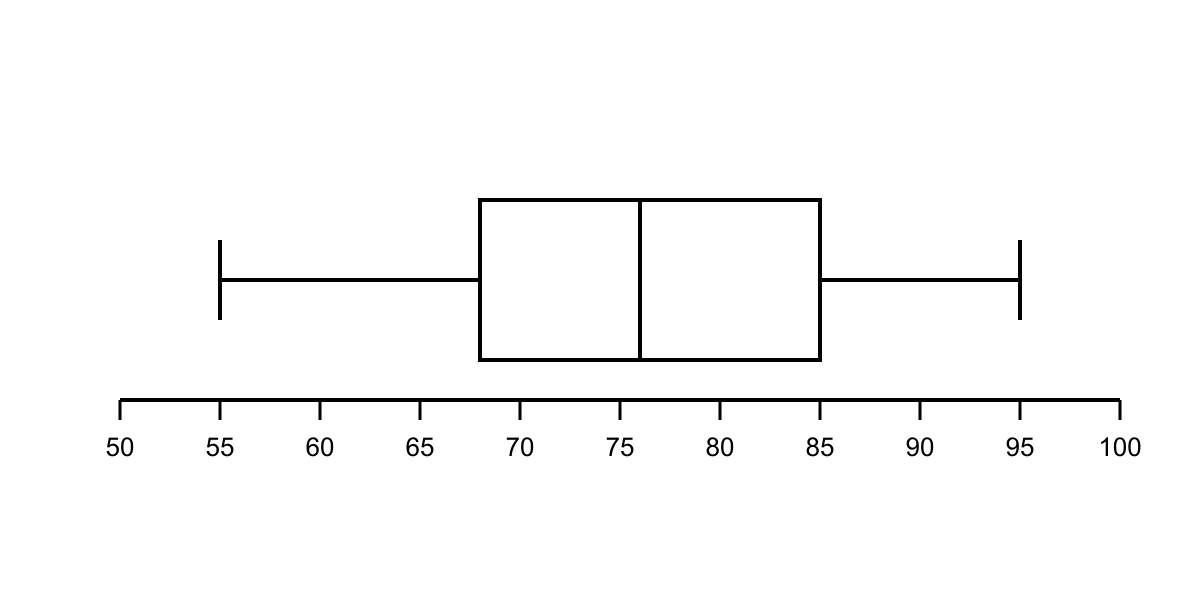
The box plot below summarizes the test scores of a class of 20 students. Refer to the box plot shown. Which of the following statements must be true?
- The mean of the scores is .
- The median of the scores is . (correct answer)
- The range of the scores is .
- Exactly students scored above .
Explanation: A box plot shows the median as the line inside the box, which is 76. The mean cannot be determined from a box plot alone (A is wrong). The range is max − min = 95 − 55 = 40, not 76 (C wrong). With 20 students, the median splits data into two halves of 10 each, but students exactly at 76 could be in either half; we cannot say exactly 10 are strictly above 76 (D wrong).