Statistical Concepts
Help Questions
Math › Statistical Concepts
What is the standard deviation of the numbers 3, 5, 8, 9, and 10?


Explanation
The first step with standard deviation is to find the average or mean of the numbers. Add 3+5+8+9+10 together to get 35. Divide that by the number of scores, which is 5, to get a mean of 7.
Now, subtract the mean from each of the numbers

Next, square those values
^{2}=16")
^{2}=4")


Now find the mean of these squared differences by adding the values and then dividing by the amount of numbers, 5 in this case.


Finally, take the square root of this number to get the standard deviation.


Determine the interquartile range of the following numbers:
42, 51, 62, 47, 38, 50, 54, 43


None of these
Explanation
How do you find the interquartile range?
We can find the interquartile range or IQR in four simple steps:
- Order the data from least to greatest
- Find the median
- Calculate the median of both the lower and upper half of the data
- The IQR is the difference between the upper and lower medians
Step 1: Order the data
In order to calculate the IQR, we need to begin by ordering the values of the data set from the least to the greatest. Likewise, in order to calculate the median, we need to arrange the numbers in ascending order (i.e. from the least to the greatest).
Let's sort an example data set with an odd number of values into ascending order.

}: 2, 2, 3, 3, 4, 5, 6, 9, 11")
Now, let's perform this task with another example data set that is comprised of an even number of values.

Rearrange into ascending order.
}: 1, 2, 2, 3, 4, 4, 7, 8, 9, 11")
Step 2: Calculate the median
Next, we need to calculate the median. The median is the "center" of the data. If the data set has an odd number of data points, then the mean is the centermost number. On the other hand, if the data set has an even number of values, then we will need to take the arithmetic average of the two centermost values. We will calculate this average by adding the two numbers together and then dividing that number by two.
First, we will find the median of a set with an odd number of values. Cross out values until you find the centermost point

The median of the odd valued data set is four.
Now, let's find the mean of the data set with an even number of values. Cross out values until you find the two centermost points and then calculate the average the two values.

Find the average of the two centermost values.


The median of the even valued set is four.
Step 3: Upper and lower medians
Once we have found the median of the entire set, we can find the medians of the upper and lower portions of the data. If the data set has an odd number of values, we will omit the median or centermost value of the set. Afterwards, we will find the individual medians for the upper and lower portions of the data.

Omit the centermost value.

Find the median of the lower portion.

Calculate the average of the two values.


The median of the lower portion is

Find the median of the upper portion.

Calculate the average of the two values.


The median of the upper potion is

If the data set has an even number of values, we will use the two values used to calculate the original median to divide the data set. These values are not omitted and become the largest value of the lower data set and the lowest values of the upper data set, respectively. Afterwards, we will calculate the medians of both the upper and lower portions.

Find the median of the lower portion.

The median of the lower portion is two.
Find the median of the upper portion.

The median of the upper portion is eight.
Step 4: Calculate the difference
Last, we need to calculate the difference of the upper and lower medians by subtracting the lower median from the upper median. This value equals the IQR.
Let's find the IQR of the odd data set.


Finally, we will find the IQR of the even data set.


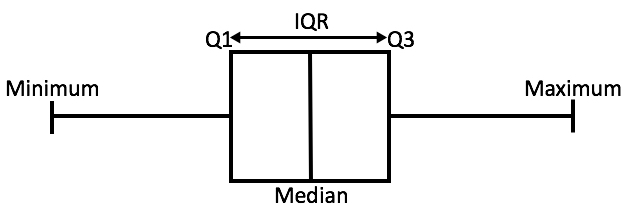
In order to better illustrate these values, their positions in a box plot have been labeled in the provided image.
Now that we have solved a few examples, let's use this knowledge to solve the given problem.
Solution:
First reorder the numbers in ascending order:
38, 42, 43, 47, 50, 51, 54, 62
Then divide the numbers into 2 groups, each containing an equal number of values:
(38, 42, 43, 47)(50, 51, 54, 62)
Q1 is the median of the group on the left, and Q3 is the median of the group on the right. Because there is an even number in each group, we'll need to find the average of the 2 middle numbers:


The interquartile range is the difference between Q3 and Q1:


Explanation

^2=variance")
or


Determine the interquartile range of the following numbers:
42, 51, 62, 47, 38, 50, 54, 43
None of these
Explanation
How do you find the interquartile range?
We can find the interquartile range or IQR in four simple steps:
- Order the data from least to greatest
- Find the median
- Calculate the median of both the lower and upper half of the data
- The IQR is the difference between the upper and lower medians
Step 1: Order the data
In order to calculate the IQR, we need to begin by ordering the values of the data set from the least to the greatest. Likewise, in order to calculate the median, we need to arrange the numbers in ascending order (i.e. from the least to the greatest).
Let's sort an example data set with an odd number of values into ascending order.
Now, let's perform this task with another example data set that is comprised of an even number of values.
Rearrange into ascending order.
Step 2: Calculate the median
Next, we need to calculate the median. The median is the "center" of the data. If the data set has an odd number of data points, then the mean is the centermost number. On the other hand, if the data set has an even number of values, then we will need to take the arithmetic average of the two centermost values. We will calculate this average by adding the two numbers together and then dividing that number by two.
First, we will find the median of a set with an odd number of values. Cross out values until you find the centermost point
The median of the odd valued data set is four.
Now, let's find the mean of the data set with an even number of values. Cross out values until you find the two centermost points and then calculate the average the two values.
Find the average of the two centermost values.
The median of the even valued set is four.
Step 3: Upper and lower medians
Once we have found the median of the entire set, we can find the medians of the upper and lower portions of the data. If the data set has an odd number of values, we will omit the median or centermost value of the set. Afterwards, we will find the individual medians for the upper and lower portions of the data.
Omit the centermost value.
Find the median of the lower portion.
Calculate the average of the two values.
The median of the lower portion is
Find the median of the upper portion.
Calculate the average of the two values.
The median of the upper potion is
If the data set has an even number of values, we will use the two values used to calculate the original median to divide the data set. These values are not omitted and become the largest value of the lower data set and the lowest values of the upper data set, respectively. Afterwards, we will calculate the medians of both the upper and lower portions.
Find the median of the lower portion.
The median of the lower portion is two.
Find the median of the upper portion.
The median of the upper portion is eight.
Step 4: Calculate the difference
Last, we need to calculate the difference of the upper and lower medians by subtracting the lower median from the upper median. This value equals the IQR.
Let's find the IQR of the odd data set.
Finally, we will find the IQR of the even data set.
In order to better illustrate these values, their positions in a box plot have been labeled in the provided image.
Now that we have solved a few examples, let's use this knowledge to solve the given problem.
Solution:
First reorder the numbers in ascending order:
38, 42, 43, 47, 50, 51, 54, 62
Then divide the numbers into 2 groups, each containing an equal number of values:
(38, 42, 43, 47)(50, 51, 54, 62)
Q1 is the median of the group on the left, and Q3 is the median of the group on the right. Because there is an even number in each group, we'll need to find the average of the 2 middle numbers:
The interquartile range is the difference between Q3 and Q1:
Thousands of people in the United States were surveyed about their grandparents. This frequency table shows their answer to the question "how many of your grandparents were born outside of the US?"
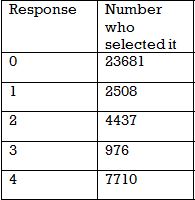
Is this data normally distributed?
No
Yes
Partly
Need more information
Explanation
No - normally distributed data has a low frequency of responses at the high and low ends. Also, the majority of the data is in the middle.
In this data set, the majority of people said "0," and the fewest people said "3" which is near the middle of the data. If this data was normally distributed we would have a higher frequency between 1 and 3 and much lower values for 0 and 4.
Calculate the standard deviation of the following data set:


Cannot be determined
Explanation
The standard deviation is found by using the following formula:

We will start by identifying the components of this equation:


Now, we can use this information to calculate the standard deviation.
First, we need to identify 


Next, we need to calculate the mean:


Second, we need to find the square of the absolute of each variable minus the mean:


Last, let's substitute these values into the standard deviation formula and solve.
}{6}}")

Solve.

Thousands of people in the United States were surveyed about their grandparents. This frequency table shows their answer to the question "how many of your grandparents were born outside of the US?"
Is this data normally distributed?
No
Yes
Partly
Need more information
Explanation
No - normally distributed data has a low frequency of responses at the high and low ends. Also, the majority of the data is in the middle.
In this data set, the majority of people said "0," and the fewest people said "3" which is near the middle of the data. If this data was normally distributed we would have a higher frequency between 1 and 3 and much lower values for 0 and 4.
Find the variance of the scores 18, 4, 9, 6, 11, and 20.


Explanation
First find the mean of the scores by adding them up and dividing by the number of scores.


Subtract the mean of 11.33 from each of the scores.


Now, square the results.

^{2}=53.73")
^{2}=5.43")
^{2}=28.41")
^{2}=0.11")

Now we need the average of these values to get the variance. First, add up these values.

Now divide by 6 which is the number of scores.
