Graphing Data
Help Questions
Math › Graphing Data


Explanation
1. Since 


2. Solve for K using the x and y values given:
")
")

3. Use the equation you solved for to find the value of y:

")

Explanation
1. Since
2. Solve for K using the x and y values given:
3. Use the equation you solved for to find the value of y:
Explanation
1. Since
2. Solve for K using the x and y values given:
3. Use the equation you solved for to find the value of y:


Explanation
1. Since 


2. Use the given x and y values to determine the value of K:


3. Using the equation along with the value of K, find the value of y when x=5:


The output of a factory in units per day versus the number of employees working is plotted on the graph below, with the following data points collected:
(Workers, Units of output per day):
")
")
")
")
Assuming a linear relationship, interpolate to find how many units will be made per day if 


Explanation
We want to do a linear interpolation since the relationship between workers and units can be assumed to be linear. This means there is a constant slope between the points, so the slope between two known points will be equal to the slope between the point we are trying to find and some known point. This is expressed in the relation:

where 

")
")
")
")
Plugging these into our interpolation formula and knowing 


Simplifying and rearranging to solve for 

So there are 

The output of a factory in units per day versus the number of employees working is plotted on the graph below, with the following data points collected:
(Workers, Units of output per day):
Assuming a linear relationship, interpolate to find how many units will be made per day if
Explanation
We want to do a linear interpolation since the relationship between workers and units can be assumed to be linear. This means there is a constant slope between the points, so the slope between two known points will be equal to the slope between the point we are trying to find and some known point. This is expressed in the relation:
where
Plugging these into our interpolation formula and knowing
Simplifying and rearranging to solve for
So there are
A student scores a 


Using this information, determine whether or not the student scored well on the SAT.
The student scored very well: above two standard deviations of the mean.
The student scored very poorly: below two standard deviations of the mean.
The student scored well: above a single standard deviation of the mean.
The student scored poorly: below a single standard deviation of the mean.
The student's score was average: similar to the mean.
Explanation
In order to solve this problem let's consider probabilities and the normal—bell curve—distribution. Given that all events are equally likely, probability is calculated using the following formula:

When probabilities of a given population are calculated for particular events, they can be graphed in a frequency chart or histogram. If they form a standard distribution, then the graph will form to the following shape:

This shape is known as a bell curve. In this curve, the mean is known as the arithmetic average and is represented as the peak. The mean alters the position of the graph. If the mean increases or decreases, then the graph shifts to the right or to the left respectively. The mean is denoted as follows:

On the other hand, the standard deviation is a calculation that indicates the average amount that each value deviates from the mean. When the standard deviation is changed then the shape of the graph is altered. When the standard deviation is decreased, the graph is taller and thinner. Likewise, when the standard deviation is increased, the graph becomes shorter and wider. It is important to note that 99.7 percent of all the values in a normal population exist between three standard deviations above and below the mean. It is denoted using the following annotation:

Now that we have discussed the components of the bell curve, let's consider the scenario presented in the question.
We know that the distribution of test scores follows a normal curve. We also know the following values:


We should first plot the data on a graph that follows the shape of a bell shaped curve with three standard deviations.
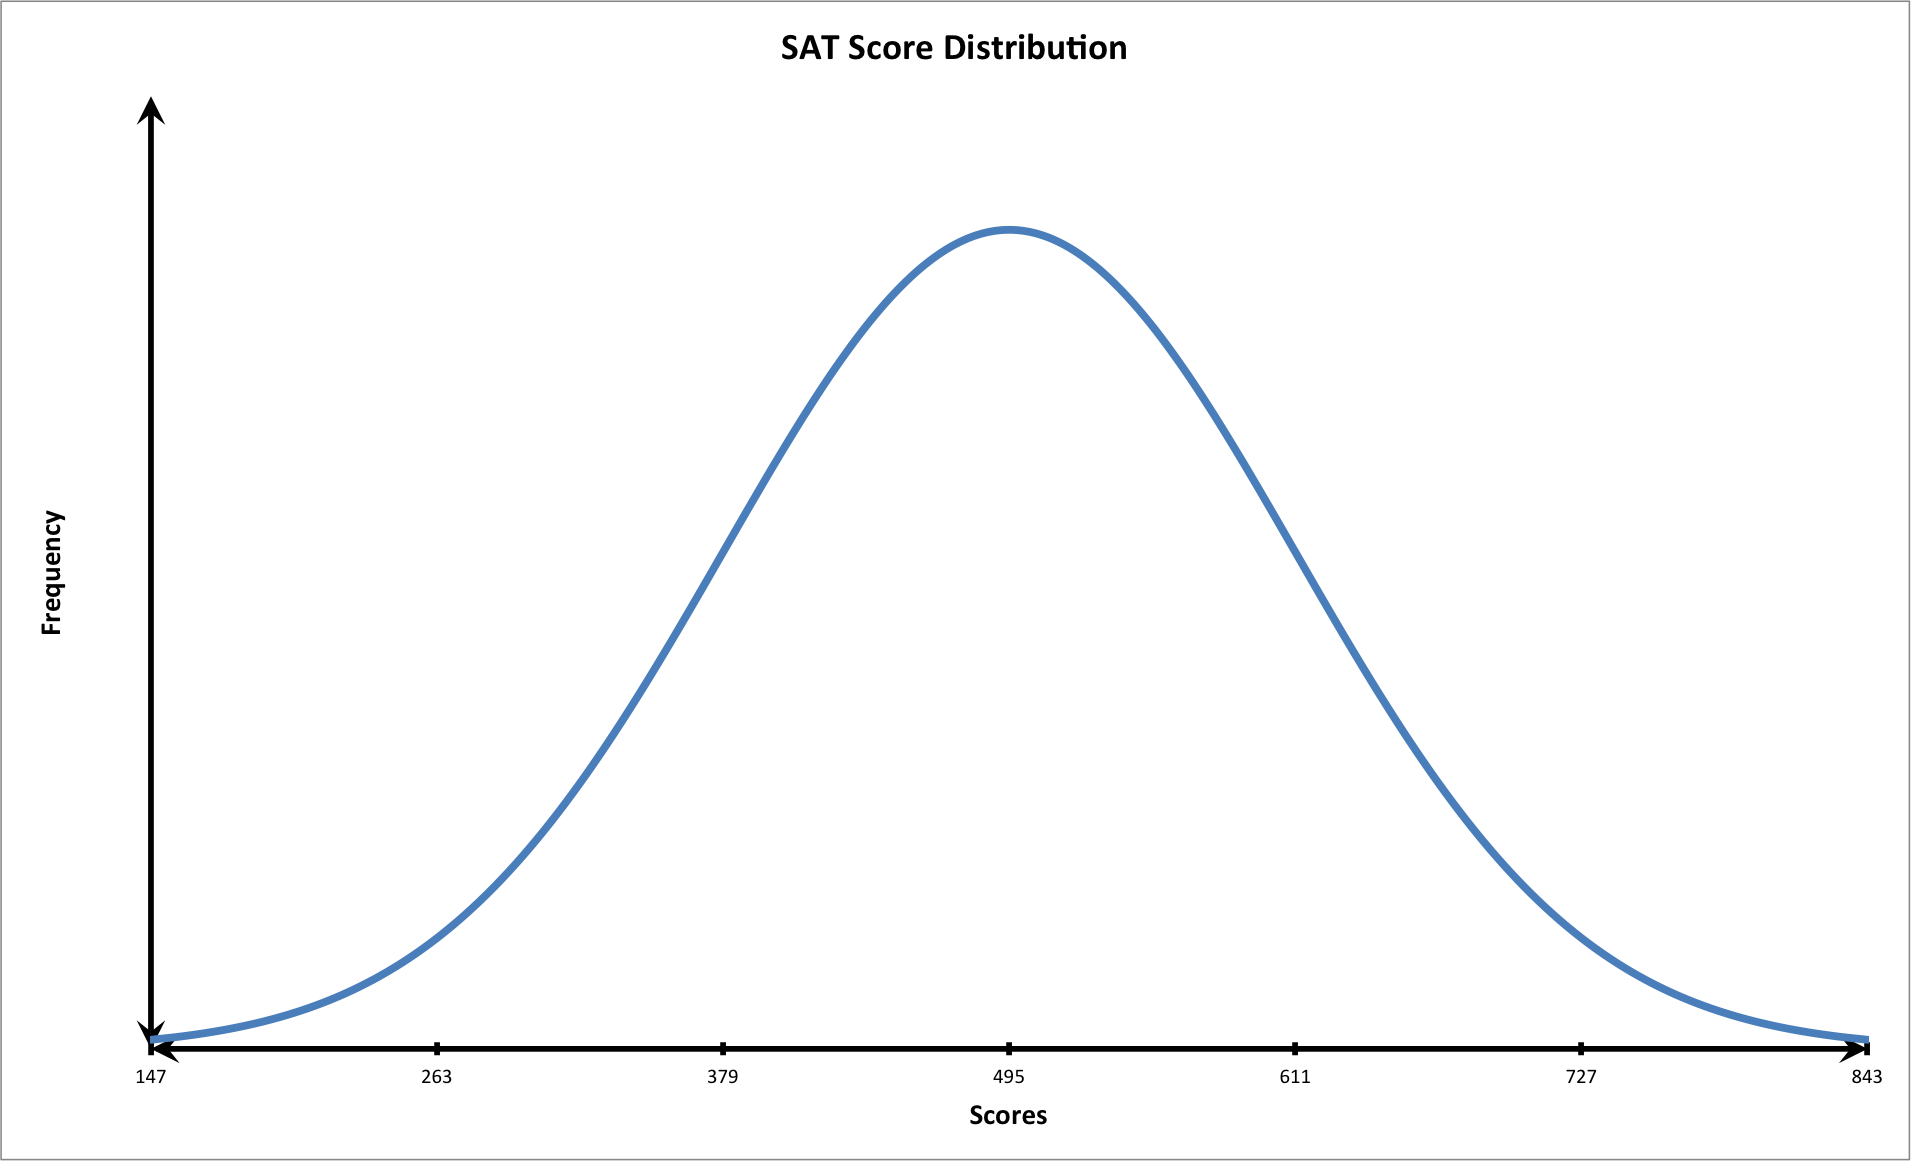
We know that the student had the following score:

Let's calculate two standard deviations above the mean.
+\bar{x}=(2\times116)+495=727")
The student scored very well: above two standard deviations from the mean. Notice that at this point on the graph, the tail of the curve is closer to the horizontal or x-axis. This means that fewer students scored this high on the exam. In other words, the student performed very well.
Explanation
1. Since
2. Use the given x and y values to determine the value of K:
3. Using the equation along with the value of K, find the value of y when x=5:
Explanation
1. Since
2. Use the given x and y values to determine the value of K:
3. Using the equation along with the value of K, find the value of y when x=5: