How to find the answer from a table
Help Questions
ISEE Middle Level Quantitative Reasoning › How to find the answer from a table
The table below gives the population of Buchanan City in each census year from 1930 to 1980.

The population figures are not available for 1990, 2000, or 2010, but it is known that the population has not decreased since 1980.
Which is the greater quantity?
(a) The population of Buchanan City in 2010
(b)

It is impossible to tell from the information given
(a) and (b) are equal
(a) is greater
(b) is greater
Explanation
Since the population has not decreased since 1980, it can be inferred that the population in 2010 was greater than or equal to that in 1980, which is 4,275. However, nothing more is known.
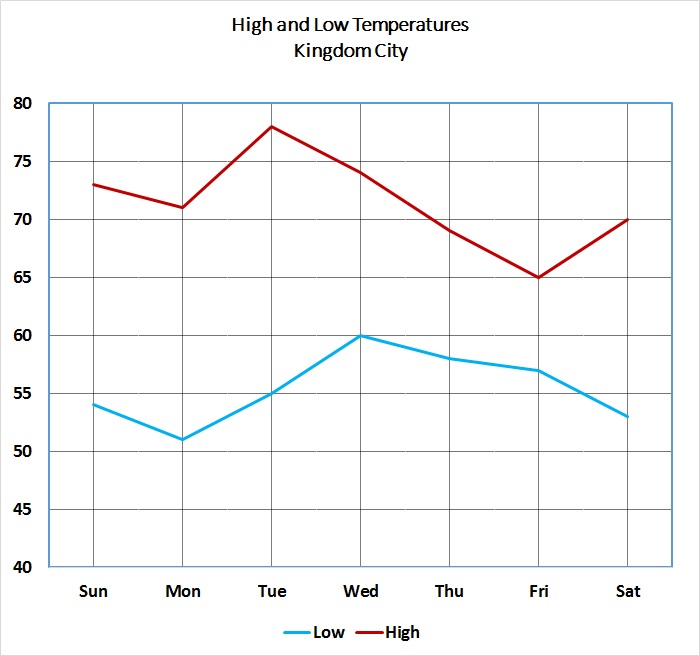
Refer to the above graph, which shows the high and low temperatures for Kingdom City over a one-week period.
On how many days did the temperature fall below 55 degrees?
Three
Four
Two
One
Explanation
To answer this question, examine the line representing the low temperatures.
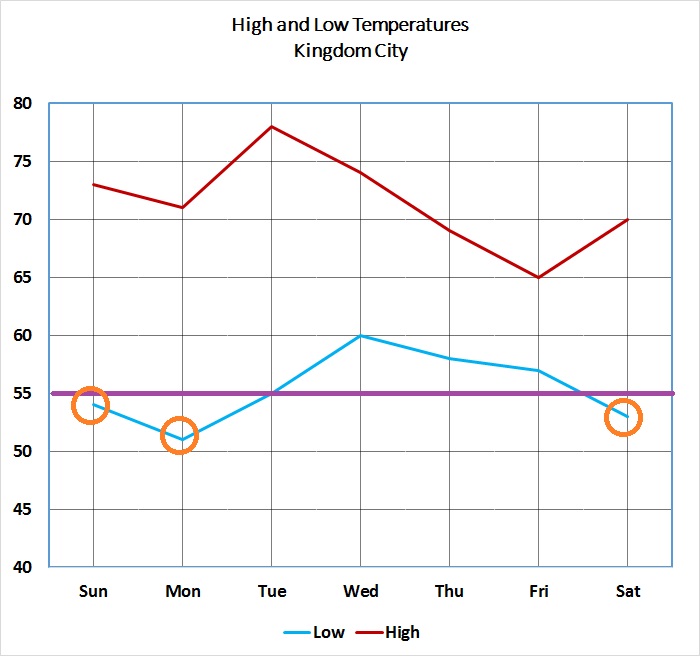
Notice that the three days on which the temperature fell below 55 have been marked with a circle (the low temperature on Tuesday was exactly 55).
Refer to the above graph, which shows the high and low temperatures for Kingdom City over a one-week period.
On how many days did the difference between the high and low temperatures reach or exceed fifteen degrees?
Four
Five
Six
Seven
Explanation
Below is the graph, this time with the temperatures represented.
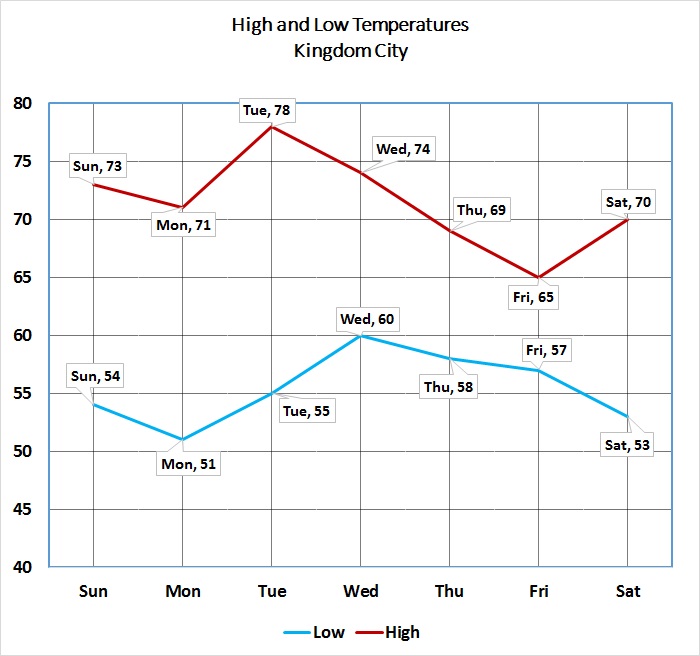
The differences between the high and low temperatures for each day are as follows:
Sunday:

Monday:

Tuesday:

Wednesday:

Thursday:

Friday:

Saturday:

The differences for four days - Sunday, Monday, Tuesday, and Saturday - all exceed 15 degrees.
The table below gives the population of Buchanan City in each census year from 1930 to 1980.

In 1930, 81% of the population of Buchanan City was non-White; in 1980, 61% was non-White.
Which is the greater quantity?
(a) The number of non-Whites living in Buchanan City in 1930
(b) The number of non-Whites living in Buchanan City in 1980
(b) is greater
It is impossible to tell from the information given
(a) is greater
(a) and (b) are equal
Explanation
(a) 81% of 2,984 is

(b) 61% of 4,275 is

(b) is greater
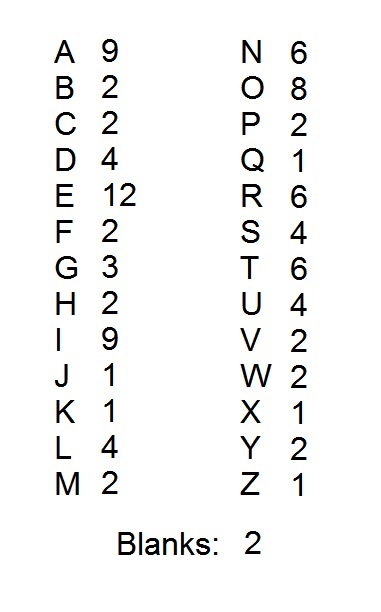
A popular word game uses one hundred tiles, each of which is marked with a letter or a blank. The distribution of the tiles is shown above, with each letter paired with the number of tiles marked with that letter. Notice that there are two blank tiles.
How many consonants are represented by as many tiles as there are "U" tiles?
(Note: for this problem, "Y" is considered a consonant)
Three
Four
Two
Five
Explanation
According to the table, there are four "U" tiles. The consonants represented by exactly four tiles are "D", "L, and "S" - three different consonants.
The table below gives the population of Buchanan City in each census year from 1930 to 1980.

Which is the greater quantity?
(a) The population of Buchanan City in 1965
(b) The population of Buchanan City in 1975
It is impossible to tell from the information given
(a) and (b) are equal
(a) is greater
(b) is greater
Explanation
No information about the population of Buchanan City is given for either 1965 or 1975.
The table below gives the population of Buchanan City in each census year from 1930 to 1980.

Which is the greater quantity?
(a) The growth in the population of Buchanan City between 1930 and 1940
(b) The growth in the population of Buchanan City between 1950 and 1960
(b) is greater
(a) is greater
(a) and (b) are equal
It is impossible to tell from the information given
Explanation
(a) Between 1930 and 1940, the population grew by

(b) Between 1950 and 1960, the population grew by 
This makes (b) greater
Refer to the above graph, which shows the high and low temperatures for Kingdom City over a one-week period.
On how many days did the temperature exceed 70 degrees?
Four
Five
Six
Seven
Explanation
To answer this question, examine the line representing the high temperatures.

Notice that the four days on which the temperature fell above 70 have been marked with a circle (the high temperature on Friday was exactly 70).
The above circle graph shows the results of a school election. According to the rules, the office of President falls to the student who wins the most votes, and the office of Vice-President falls to the student who finishes second. A runoff only happens in case of a tie.
Which of the following is the result of this election?
Phelps was elected President and Creighton was elected Vice-President.
Phelps and Creighton will face each other in a runoff to determine which will be President and which will be Vice-President.
Phelps and Wells will face each other in a runoff to determine which will be President and which will be Vice-President.
Phelps was elected President and Wells was elected Vice-President.
Phelps was elected President; Creighton and Wells will face each other in a runoff to determine who will be Vice-President.
Explanation
The two largest portions of the pie graph are light blue (Phelps) and orange (Creighton); Phelps got the most votes and Creighton got the second-most. Therefore, Phelps was elected President and Creighton was elected Vice-President - there will be no runoffs.
The above circle graph shows the results of a school election. According to the rules, the office of President falls to the student who wins the most votes; the office of Vice-President falls to the student who finishes second; the office of Secretary-Treasurer falls to the student who finishes third. A runoff only happens in case of a tie.
Which candidate was elected Secretary-Treasurer?
Wells was elected Secretary-Treasurer.
Creighton was elected Secretary-Treasurer.
Hawley was elected Secretary-Treasurer.
Wells and Hawley will face each other in a runoff.
Wells and Creighton will face each other in a runoff.
Explanation
The third-largest portion of the circle graph is gray, which, according to the legend, corresponds to Wells's share of the vote. Wells was elected Secretary-Treasurer outright.