How to find a complex fraction - GRE Quantitative Reasoning
Card 1 of 24
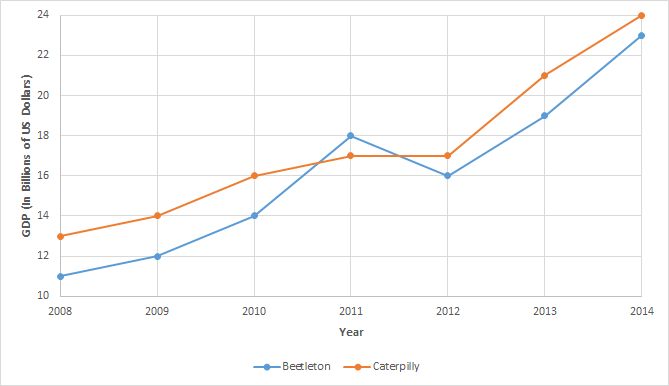
For what year was there the greatest percent difference between the GDPs of Beetleton and Catterpilly?
For what year was there the greatest percent difference between the GDPs of Beetleton and Catterpilly?
Tap to reveal answer
The simplest way to do this problem is visually. From looking at the graph, the greatest difference between Beetleton and Caterpilly is 2 billion US, and this difference is also observed where those points for Beetleton and Caterpilly are closest to the x-axis: 2008.
Of course, the percent differences can also be calculated using the formula:
/2}$ \right |")
and for each year, the percent differences are as follows:


Of course this method is much more time consuming.
The simplest way to do this problem is visually. From looking at the graph, the greatest difference between Beetleton and Caterpilly is 2 billion US, and this difference is also observed where those points for Beetleton and Caterpilly are closest to the x-axis: 2008.
Of course, the percent differences can also be calculated using the formula:
and for each year, the percent differences are as follows:
Of course this method is much more time consuming.
← Didn't Know|Knew It →
Caterpilly is projected to see the same percentage growth from 2014 to 2015 as was seen between 2010 and 2011. What is the approximate projected GDP for Caterpilly in 2015 in billions of US dollars to the nearest tenth?
Caterpilly is projected to see the same percentage growth from 2014 to 2015 as was seen between 2010 and 2011. What is the approximate projected GDP for Caterpilly in 2015 in billions of US dollars to the nearest tenth?
Tap to reveal answer
Percent growth is given by the formula:

So the percent grown for Caterpilly from 2010 to 2011 is:

Conversely, if percent growth is known, a new value can be found as follows:
The GDP for 2014 is  ( in billions US dollars), so the projected GDP in billions of US dollars for 2015 is:
Percent growth is given by the formula:
So the percent grown for Caterpilly from 2010 to 2011 is:
Conversely, if percent growth is known, a new value can be found as follows:
The GDP for 2014 is
← Didn't Know|Knew It →
Megaton High is holding elections for the school president, vice president, and chief hall monitor, as well four secretarial positions which are identical. If a total of  students are in the running for either president, vice president, or hall monitor,
  students are in the running for the secretarial positions, and no student can hold more than one position, how many possible election results are possible?
Megaton High is holding elections for the school president, vice president, and chief hall monitor, as well four secretarial positions which are identical. If a total of
Tap to reveal answer
For this problem, note that for the  students elected from the
  running for either president, vice president, and hall monitor, position matters, and so this is dealing with a permution, with the following number of potential outcomes:
=\frac{n!}{(n-k!)}$=\frac{12!}{(12-3)!}$=1320")
However, for the second election, in which  students are competing for
  positions, since all the secretarial offices are equal, position does not matter, and so we are dealing with a combination:
=\frac{n!}{(n-k)!k!}$=\frac{21!}{(21-4)!4!}$=5985")
The total potential outcomes is given by the product of these two values:

For this problem, note that for the
However, for the second election, in which
The total potential outcomes is given by the product of these two values:
← Didn't Know|Knew It →
For what year was there the greatest percent difference between the GDPs of Beetleton and Catterpilly?
For what year was there the greatest percent difference between the GDPs of Beetleton and Catterpilly?
Tap to reveal answer
The simplest way to do this problem is visually. From looking at the graph, the greatest difference between Beetleton and Caterpilly is 2 billion US, and this difference is also observed where those points for Beetleton and Caterpilly are closest to the x-axis: 2008.
Of course, the percent differences can also be calculated using the formula:
and for each year, the percent differences are as follows:
Of course this method is much more time consuming.
← Didn't Know|Knew It →
Caterpilly is projected to see the same percentage growth from 2014 to 2015 as was seen between 2010 and 2011. What is the approximate projected GDP for Caterpilly in 2015 in billions of US dollars to the nearest tenth?
Caterpilly is projected to see the same percentage growth from 2014 to 2015 as was seen between 2010 and 2011. What is the approximate projected GDP for Caterpilly in 2015 in billions of US dollars to the nearest tenth?
Tap to reveal answer
Percent growth is given by the formula:
So the percent grown for Caterpilly from 2010 to 2011 is:
Conversely, if percent growth is known, a new value can be found as follows:
The GDP for 2014 is ( in billions US dollars), so the projected GDP in billions of US dollars for 2015 is:
Percent growth is given by the formula:
So the percent grown for Caterpilly from 2010 to 2011 is:
Conversely, if percent growth is known, a new value can be found as follows:
The GDP for 2014 is
← Didn't Know|Knew It →
Megaton High is holding elections for the school president, vice president, and chief hall monitor, as well four secretarial positions which are identical. If a total of students are in the running for either president, vice president, or hall monitor, students are in the running for the secretarial positions, and no student can hold more than one position, how many possible election results are possible?
Megaton High is holding elections for the school president, vice president, and chief hall monitor, as well four secretarial positions which are identical. If a total of
Tap to reveal answer
For this problem, note that for the students elected from the running for either president, vice president, and hall monitor, position matters, and so this is dealing with a permution, with the following number of potential outcomes:
However, for the second election, in which students are competing for positions, since all the secretarial offices are equal, position does not matter, and so we are dealing with a combination:
The total potential outcomes is given by the product of these two values:
For this problem, note that for the
However, for the second election, in which
The total potential outcomes is given by the product of these two values:
← Didn't Know|Knew It →
For what year was there the greatest percent difference between the GDPs of Beetleton and Catterpilly?
For what year was there the greatest percent difference between the GDPs of Beetleton and Catterpilly?
Tap to reveal answer
The simplest way to do this problem is visually. From looking at the graph, the greatest difference between Beetleton and Caterpilly is 2 billion US, and this difference is also observed where those points for Beetleton and Caterpilly are closest to the x-axis: 2008.
Of course, the percent differences can also be calculated using the formula:
and for each year, the percent differences are as follows:
Of course this method is much more time consuming.
The simplest way to do this problem is visually. From looking at the graph, the greatest difference between Beetleton and Caterpilly is 2 billion US, and this difference is also observed where those points for Beetleton and Caterpilly are closest to the x-axis: 2008.
Of course, the percent differences can also be calculated using the formula:
and for each year, the percent differences are as follows:
Of course this method is much more time consuming.
← Didn't Know|Knew It →
Caterpilly is projected to see the same percentage growth from 2014 to 2015 as was seen between 2010 and 2011. What is the approximate projected GDP for Caterpilly in 2015 in billions of US dollars to the nearest tenth?
Caterpilly is projected to see the same percentage growth from 2014 to 2015 as was seen between 2010 and 2011. What is the approximate projected GDP for Caterpilly in 2015 in billions of US dollars to the nearest tenth?
Tap to reveal answer
Percent growth is given by the formula:
So the percent grown for Caterpilly from 2010 to 2011 is:
Conversely, if percent growth is known, a new value can be found as follows:
The GDP for 2014 is ( in billions US dollars), so the projected GDP in billions of US dollars for 2015 is:
Percent growth is given by the formula:
So the percent grown for Caterpilly from 2010 to 2011 is:
Conversely, if percent growth is known, a new value can be found as follows:
The GDP for 2014 is
← Didn't Know|Knew It →