Question 1
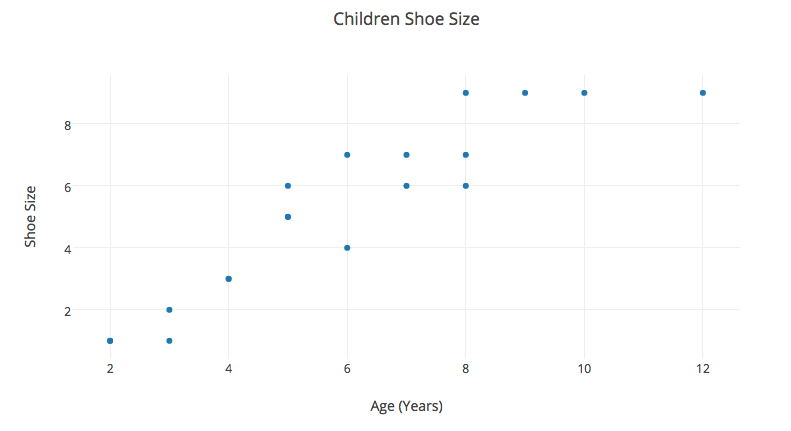
The graph above plots sixteen points that each describe the shoe size of sixteen individual children.
Identify the missing information of the following statement.
The relationship between the age of the child and the child's shoe size is .
- positive
- negative
- zero
Explanation: Looking at the graph, first identify the points.
There are sixteen points: (2,1), (3,1), (3,2), (4,3), (5,5), (5,6), (6,4), (6, 7), (7,6), (7,7), (8,6), (8,7), (8,9), (9,9), (10,9), (12,9)
The line of best fit can be drawn on the image and it would have a positive slope.
It is seen that as the age of the children increases that the shoe size also increases.
Therefore there is a positive relationship between the child's age and shoe size.