All questions
Question 1
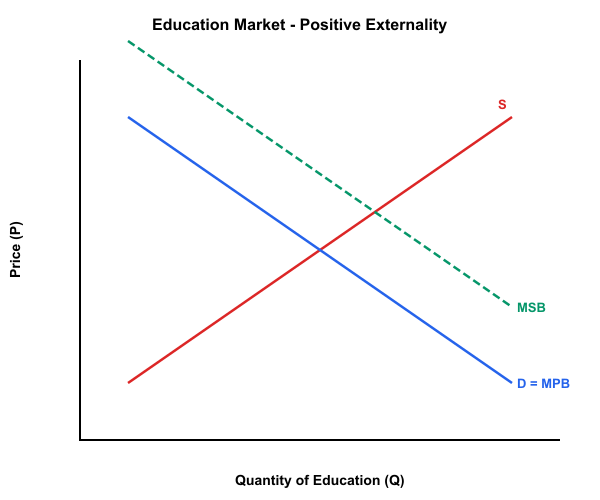
A market for education (years of schooling) creates a positive externality because more educated workers raise productivity and civic participation. Based on the externality shown in the graph, is the market outcome socially efficient?
Curves (linear):
- Demand: D=MPB:P=90−3Q
- Social benefit: MSB:P=120−3Q
- Supply: S=MPC=MSC:P=0+3Q
(Price/Cost on vertical axis; Quantity of years of schooling (in millions) on horizontal axis.)
- Yes; because MSC=MPC, the market equilibrium is socially optimal even when MSB>MPB.
- No; the market overproduces because MSC>MPC, so the efficient quantity is less than the market quantity.
- Yes; because MSB is above MPB, the market equilibrium quantity is efficient.
- No; the market underproduces because MSB>MPB, so the efficient quantity is greater than the market quantity. (correct answer)
- No; the external benefit is a transfer only, so there is no inefficiency.
Explanation: This question tests your understanding of externalities and market efficiency in AP Microeconomics. A positive externality occurs when production or consumption provides unaccounted benefits to third parties, making marginal social benefit (MSB) greater than marginal private benefit (MPB), while a negative externality imposes unaccounted costs, making marginal social cost (MSC) greater than marginal private cost (MPC). In the graph, the MSB curve is above the MPB curve, showing the positive externality from education's societal benefits, with MSC equal to MPC. The market outcome is not socially efficient because it underproduces, as MSB > MPB leads to an efficient quantity greater than the market quantity where MPB = MPC. A common misconception is that the market equilibrium equals the social optimum, but with positive externalities, the market fails to account for external benefits, resulting in inefficiency. To analyze such problems, always compare marginal social costs to marginal social benefits. The efficient outcome occurs where MSC equals MSB, maximizing net social welfare.
Question 2
A market for ride-sharing trips is shown in the graph. Additional trips increase traffic congestion for other drivers, a negative externality. Based on the externality shown in the graph, what is the socially optimal quantity of ride-sharing trips?
- Q=20 trips, because it is where S=MPC intersects D=MPB
- Q=30 trips, because it is where MSC intersects D=MSB
- Q=25 trips, because it is where MSC intersects D=MSB (correct answer)
- Q=25 trips, because it is where S=MPC intersects MSC
- Q=30 trips, because it is where S=MPC intersects D=MPB
Explanation: This question tests your understanding of externalities and efficiency in markets. A negative externality occurs when consumption imposes uncompensated costs on third parties, like traffic congestion, while a positive externality provides benefits; marginal social cost (MSC) equals marginal private cost (MPC) plus external costs, and marginal social benefit (MSB) equals marginal private benefit (MPB) plus external benefits. The graph shows the MSC curve above the S=MPC supply curve due to the congestion externality, with demand as D=MPB=MSB. The socially optimal quantity is Q=25 trips, because it is where MSC intersects D=MSB, equating full societal costs and benefits for maximum welfare. A common misconception is that the market equilibrium equals the social optimum, but negative externalities cause overproduction as private costs ignore external harms. To analyze similar problems, compare MSC to MSB on the graph. The efficient outcome occurs where MSC equals MSB.
Question 3
A market for fireworks produces a negative externality from noise and air pollution affecting nearby residents. Based on the externality shown in the graph, is the market outcome socially efficient?
Curves (linear):
- Demand: D=MSB=MPB:P=50−Q
- Private supply: S=MPC:P=5+Q
- Social cost: MSC:P=15+Q
(Price/Cost on vertical axis; Quantity of fireworks packs on horizontal axis.)
- Yes; because MSB=MPB, the market equilibrium equals the socially optimal quantity.
- No; the market underproduces because MSB>MPB, so the efficient quantity is greater than the market quantity.
- No; the market overproduces because MSC>MPC, so the efficient quantity is less than the market quantity. (correct answer)
- Yes; because MSC lies above demand, the market equilibrium is efficient.
- No; the external cost is a transfer only, so there is no efficiency loss.
Explanation: This question tests your understanding of externalities and market efficiency in AP Microeconomics. A negative externality occurs when production or consumption imposes unaccounted costs on third parties, making marginal social cost (MSC) greater than marginal private cost (MPC), while a positive externality provides unaccounted benefits, making marginal social benefit (MSB) greater than marginal private benefit (MPB). In the graph, the MSC curve is above the MPC curve, indicating the negative externality from fireworks noise and pollution, with MSB equal to MPB. The market outcome is not socially efficient because it overproduces, as MSC > MPC leads to an efficient quantity less than the market quantity where MPB = MPC. A common misconception is that the market equilibrium equals the social optimum, but with negative externalities, the market fails to account for external costs, causing inefficiency. To analyze such problems, always compare marginal social costs to marginal social benefits. The efficient outcome occurs where MSC equals MSB, maximizing net social welfare.
Question 4
A market for chemical solvent used by factories is shown in the graph. Disposal contaminates groundwater, creating a negative externality. Based on the externality shown, which curve represents the marginal social cost (MSC)?
- The demand curve labeled D=MPB
- The supply curve labeled S=MPC
- The upward-sloping curve above S=MPC labeled MSC (correct answer)
- The curve where S=MPC intersects D=MPB
- The downward-sloping curve above D=MPB labeled MSB
Explanation: This question tests your understanding of externalities and efficiency in markets. A negative externality occurs when production imposes uncompensated costs on third parties, like groundwater contamination, while a positive externality provides benefits; marginal social cost (MSC) equals marginal private cost (MPC) plus external costs, and marginal social benefit (MSB) equals marginal private benefit (MPB) plus external benefits. The graph shows the MSC curve as the upward-sloping line above S=MPC due to the disposal externality, with demand as D=MPB=MSB. The curve representing marginal social cost (MSC) is the upward-sloping curve above S=MPC labeled MSC, as it incorporates the external costs of contamination. A common misconception is that the market equilibrium equals the social optimum, but negative externalities cause overproduction by ignoring these added social costs. To analyze similar problems, compare MSC to MSB on the graph. The efficient outcome occurs where MSC equals MSB.
Question 5
A market for lawn-care services is illustrated in the graph. Gas-powered mowing creates noise that affects neighbors, a negative externality. Based on the externality shown in the graph, is the market outcome socially efficient?
- Yes; the market outcome is efficient because S=MPC already includes all costs
- No; the market overproduces because MSC lies above MPC, so Qm>Q∗ (correct answer)
- No; the market underproduces because MSC lies above MPC, so Qm<Q∗
- Yes; the market outcome is efficient because Qm occurs where MSC intersects D=MSB
- No; the externality is only a transfer, so efficiency is unchanged
Explanation: This question tests your understanding of externalities and efficiency in markets. A negative externality occurs when production imposes uncompensated costs on third parties, like noise pollution, while a positive externality provides uncompensated benefits; marginal social cost (MSC) equals marginal private cost (MPC) plus external costs, and marginal social benefit (MSB) equals marginal private benefit (MPB) plus external benefits. The graph shows the MSC curve above the S=MPC supply curve due to the noise externality, with demand as D=MPB=MSB. The market outcome is not socially efficient because it overproduces, as MSC lies above MPC leading to Qm > Q* where social costs exceed benefits beyond the optimum. A common misconception is that the market equilibrium equals the social optimum, but negative externalities cause inefficiency through overproduction ignoring external costs. To analyze similar problems, compare MSC to MSB on the graph. The efficient outcome occurs where MSC equals MSB.
Question 6
A market for home insulation reduces energy use, which lowers local air pollution (a positive externality). Based on the externality shown in the graph, what is the socially optimal quantity of insulation installations (in thousands per year)?
- Q=10 thousand, because it is where D=MPB intersects MSB.
- Q=20 thousand, because it is where S=MPC intersects D=MPB.
- Q=30 thousand, because it is where S=MPC intersects MSB. (correct answer)
- Q=15 thousand, because it is where S=MPC intersects MSB.
- Q=20 thousand, because it is where S=MPC intersects MSC.
Explanation: This question tests your understanding of externalities and efficiency in markets with positive externalities. A positive externality occurs when production or consumption creates benefits for third parties not involved in the transaction, while a negative externality imposes costs; here, home insulation reduces energy use and air pollution, benefiting the community beyond the homeowner, making the marginal social benefit (MSB) higher than the marginal private benefit (MPB). The graph shows MSB above the demand curve (D=MPB), indicating the true benefit to society exceeds what buyers consider. The socially optimal quantity occurs where marginal social cost equals marginal social benefit (MSC = MSB), which happens at Q = 30 thousand installations where S=MPC intersects MSB (since there's no production externality, MSC = MPC). A common misconception is that the market equilibrium (where S=MPC intersects D=MPB at Q = 20 thousand) represents the efficient outcome, but this ignores the external benefits to the community. To find the efficient quantity with any externality, compare MSC to MSB—the efficient point is where they're equal. With positive consumption externalities, this means finding where the supply curve intersects the higher MSB curve.
Question 7
A city market for electricity from coal-fired power plants generates air pollution that harms nearby residents (a negative externality). Based on the externality shown in the graph, what is the socially optimal quantity of electricity (in million kWh per month)?
- Q=20 million kWh, because it is where MSC intersects D=MSB. (correct answer)
- Q=30 million kWh, because it is where S=MPC intersects D=MPB.
- Q=40 million kWh, because it is where MSC intersects the quantity axis.
- Q=10 million kWh, because it is where S=MPC intersects MSC.
- Q=30 million kWh, because it is where MSC intersects D=MSB.
Explanation: This question tests your understanding of externalities and efficiency in markets with negative externalities. A negative externality occurs when production or consumption imposes costs on third parties not involved in the transaction, while a positive externality creates benefits for third parties; here, coal-fired electricity creates air pollution harming residents, making the marginal social cost (MSC) higher than the marginal private cost (MPC). The graph shows MSC above the supply curve (S=MPC), indicating the true cost to society exceeds what producers consider. The socially optimal quantity occurs where marginal social cost equals marginal social benefit (MSC = MSB), which happens at Q = 20 million kWh where these curves intersect. A common misconception is that the market equilibrium (where S=MPC intersects D=MPB at Q = 30) represents the efficient outcome, but this ignores the external costs. To find the efficient quantity with any externality, locate where MSC intersects MSB (which equals D=MPB when there's no consumption externality). This transferable strategy ensures you account for all social costs and benefits, not just private ones.
Question 8
A market for bottled water generates plastic waste that harms wildlife (a negative externality). Based on the externality shown in the graph, is the market outcome socially efficient?
- Yes; the market equilibrium is efficient because MSC intersects D=MPB at the market quantity.
- No; the market equilibrium overproduces because MSC lies above S=MPC, so Qmarket>Q∗. (correct answer)
- No; the market equilibrium underproduces because MSC lies above S=MPC, so Qmarket<Q∗.
- Yes; the market equilibrium is efficient because the externality is a transfer and does not change MSC.
- Yes; the market equilibrium is efficient because S=MPC is upward sloping.
Explanation: This question tests your understanding of externalities and efficiency by asking whether a market with negative externalities achieves social efficiency. A negative externality occurs when production or consumption imposes costs on third parties (here, plastic waste harming wildlife), while a positive externality creates benefits; this makes the marginal social cost (MSC) higher than the marginal private cost (MPC). The graph shows MSC lying above S=MPC, indicating that the true cost to society exceeds what bottled water producers consider in their decisions. The market equilibrium occurs where S=MPC intersects D=MPB, but the socially optimal quantity occurs where MSC intersects MSB (which equals D=MPB when there's no consumption externality)—since MSC > MPC at the market quantity, the market overproduces relative to the social optimum (Qmarket > Q*). A common misconception is that externalities might be just transfers that don't affect efficiency, but they represent real costs or benefits to society. To determine efficiency with externalities, check if MSC equals MSB at the market quantity. When MSC lies above MPC due to negative externalities, the market will overproduce because producers don't internalize the environmental damage.
Question 9
A market for flu vaccinations reduces the spread of illness to others (a positive externality). Based on the externality shown in the graph, is the market outcome socially efficient?
- No; the market equilibrium underproduces because MSB lies above D=MPB, so Qmarket<Q∗. (correct answer)
- No; the market equilibrium overproduces because MSB lies below D=MPB, so Qmarket>Q∗.
- Yes; the market equilibrium is efficient because S=MPC intersects MSB at the same quantity as D=MPB.
- Yes; the market equilibrium is efficient because positive externalities do not affect efficiency.
- No; the market equilibrium is inefficient because MSC lies above S=MPC, so Qmarket>Q∗.
Explanation: This question tests your understanding of externalities and efficiency by asking whether a market with positive externalities achieves social efficiency. A positive externality occurs when production or consumption creates benefits for third parties (here, flu vaccinations reducing illness spread), while a negative externality imposes costs; this makes the marginal social benefit (MSB) higher than the marginal private benefit (MPB). The graph shows MSB lying above D=MPB, indicating that the true benefit to society exceeds what buyers consider in their decisions. The market equilibrium occurs where S=MPC intersects D=MPB, but the socially optimal quantity occurs where MSC (which equals S=MPC when there's no production externality) intersects MSB—since MSB > MPB at the market quantity, the market underproduces relative to the social optimum (Qmarket < Q*). A common misconception is that positive externalities don't affect efficiency, but they cause markets to produce less than the socially optimal amount. To determine efficiency with externalities, compare the market quantity to where MSC equals MSB. When MSB lies above MPB, the market will underproduce because buyers don't capture the full social benefit.
Question 10
A market for plastic shopping bags creates a negative externality because litter harms wildlife and increases cleanup costs. Based on the externality shown in the graph, what is the socially optimal quantity of plastic bags (in thousands per week)?
Curves (linear):
- Demand: D=MSB=MPB:P=60−2Q
- Private supply: S=MPC:P=0+Q
- Social cost: MSC:P=10+Q
(Price/Cost on vertical axis; Quantity in thousands per week on horizontal axis.)
- Q=20 thousand bags per week
- Q=25 thousand bags per week
- Q=16.7 thousand bags per week (correct answer)
- Q=15 thousand bags per week
- Q=30 thousand bags per week
Explanation: This question tests your understanding of externalities and market efficiency in AP Microeconomics. A negative externality occurs when production or consumption imposes unaccounted costs on third parties, making marginal social cost (MSC) greater than marginal private cost (MPC), while a positive externality provides unaccounted benefits, making marginal social benefit (MSB) greater than marginal private benefit (MPB). In the graph, the MSC curve is above the MPC curve, indicating the negative externality from plastic bag litter, with MSB equal to MPB. The socially optimal quantity is where MSB equals MSC, solving 60 - 2Q = 10 + Q to get Q = 50/3 ≈ 16.7 thousand bags per week, justifying lower output to internalize external costs. A common misconception is that the market equilibrium equals the social optimum, but with negative externalities, the market overproduces by ignoring external costs. To analyze such problems, always compare marginal social costs to marginal social benefits. The efficient outcome occurs where MSC equals MSB, maximizing net social welfare.
Question 11
A market for beekeeping services creates a positive externality because bees pollinate nearby crops. Based on the externality shown in the graph, is the market outcome socially efficient?
Curves (linear):
- Demand: D=MPB:P=70−2Q
- Social benefit: MSB:P=90−2Q
- Supply: S=MPC=MSC:P=10+Q
(Price/Cost on vertical axis; Quantity of beekeeping service contracts on horizontal axis.)
- Yes; because MPB=MSB at all quantities, the market equilibrium is efficient.
- No; the market underproduces because MSB>MPB, so the efficient quantity is greater than the market quantity. (correct answer)
- No; the market overproduces because MSC>MPC, so the efficient quantity is less than the market quantity.
- Yes; because MSC=MPC, any equilibrium quantity is socially optimal.
- No; the external benefit is a transfer only, so there is no inefficiency.
Explanation: This question tests your understanding of externalities and market efficiency in AP Microeconomics. A positive externality occurs when production or consumption provides unaccounted benefits to third parties, making marginal social benefit (MSB) greater than marginal private benefit (MPB), while a negative externality imposes unaccounted costs, making marginal social cost (MSC) greater than marginal private cost (MPC). In the graph, the MSB curve is above the MPB curve, illustrating the positive externality from beekeeping pollination, with MSC equal to MPC. The market outcome is not socially efficient because it underproduces, as MSB > MPB leads to an efficient quantity greater than the market quantity where MPB = MPC. A common misconception is that the market equilibrium equals the social optimum, but with positive externalities, the market fails to account for external benefits, resulting in inefficiency. To analyze such problems, always compare marginal social costs to marginal social benefits. The efficient outcome occurs where MSC equals MSB, maximizing net social welfare.
Question 12
A market for residential insulation services is shown in the graph. Better insulation reduces energy use and local air pollution, creating a positive externality. Based on the externality shown in the graph, what is the socially optimal quantity of insulation services?
- Q=15 services, because it is where S=MPC intersects D=MPB
- Q=25 services, because it is where S=MPC intersects MSB (correct answer)
- Q=25 services, because it is where MSC intersects MPB
- Q=15 services, because it is where MSC intersects MSB
- Q=35 services, because it is where MPB intersects MSB
Explanation: This question tests your understanding of externalities and efficiency in markets. A positive externality occurs when consumption provides uncompensated benefits to third parties, like reduced pollution from insulation, while a negative externality imposes costs; marginal social benefit (MSB) equals marginal private benefit (MPB) plus external benefits, and marginal social cost (MSC) equals marginal private cost (MPC) plus external costs. The graph shows the MSB curve above the D=MPB demand curve due to the energy-saving externality, with supply as S=MPC=MSC. The socially optimal quantity is Q=25 services, because it is where S=MPC intersects MSB, equating social benefits with costs for maximum welfare. A common misconception is that the market equilibrium equals the social optimum, but positive externalities cause underproduction as private benefits ignore external gains. To analyze similar problems, compare MSC to MSB on the graph. The efficient outcome occurs where MSC equals MSB.
Question 13
A market for public certification classes in food safety is shown. Certification reduces the risk of foodborne illness for customers, creating a positive externality. Based on the externality shown in the graph, is the market outcome socially efficient?
- Yes; the market outcome is efficient because MSC exceeds MPC
- No; the market overproduces because MSB lies above MPB, so Qm>Q∗
- No; the market underproduces because MSB lies above MPB, so Qm<Q∗ (correct answer)
- Yes; the market outcome is efficient because Qm occurs where MSB intersects MSC
- No; the externality is only a transfer, so Qm is efficient
Explanation: This question tests your understanding of externalities and efficiency in markets. A positive externality occurs when consumption provides uncompensated benefits to third parties, like reduced illness from certification, while a negative externality imposes costs; marginal social benefit (MSB) equals marginal private benefit (MPB) plus external benefits, and marginal social cost (MSC) equals marginal private cost (MPC) plus external costs. The graph shows the MSB curve above the D=MPB demand curve due to the safety externality, with supply as S=MPC=MSC. The market outcome is not socially efficient because it underproduces, as MSB lies above MPB leading to Qm < Q* where additional units would yield net social gains. A common misconception is that the market equilibrium equals the social optimum, but positive externalities cause inefficiency through underproduction ignoring external benefits. To analyze similar problems, compare MSC to MSB on the graph. The efficient outcome occurs where MSC equals MSB.
Question 14
A market for beekeeping services (hives placed near orchards) increases nearby crop yields (a positive externality). Based on the externality shown in the graph, what is the socially optimal quantity of beekeeping services (in hundreds of hive-months)?
- Q=30 hundred hive-months, because it is where S=MPC intersects D=MPB.
- Q=40 hundred hive-months, because it is where S=MPC intersects MSB. (correct answer)
- Q=20 hundred hive-months, because it is where MSB intersects the price axis.
- Q=30 hundred hive-months, because it is where S=MPC intersects MSB.
- Q=10 hundred hive-months, because it is where MSB intersects D=MPB.
Explanation: This question tests your understanding of externalities and efficiency in markets with positive externalities. A positive externality occurs when production or consumption creates benefits for third parties not involved in the transaction, while a negative externality imposes costs; here, beekeeping services increase crop yields for nearby farmers, making the marginal social benefit (MSB) higher than the marginal private benefit (MPB). The graph shows MSB above the demand curve (D=MPB), indicating the true benefit to society exceeds what buyers consider. The socially optimal quantity occurs where marginal social cost equals marginal social benefit (MSC = MSB), which happens at Q = 40 hundred hive-months where S=MPC intersects MSB (since there's no production externality, MSC = MPC). A common misconception is that the market equilibrium (where S=MPC intersects D=MPB at Q = 30) represents the efficient outcome, but this ignores the external benefits. To find the efficient quantity with any externality, compare MSC to MSB—the efficient point is where they're equal. With positive externalities and no production externality, this means finding where the supply curve intersects the MSB curve.
Question 15
A market for ride-sharing trips in a downtown area increases traffic congestion for other drivers (a negative externality). Based on the externality shown in the graph, what is the socially optimal quantity of ride-sharing trips (in thousands per day)?
- Q=25 thousand, because it is where S=MPC intersects D=MPB.
- Q=15 thousand, because it is where MSC intersects D=MSB. (correct answer)
- Q=20 thousand, because it is where MSC intersects S=MPC.
- Q=30 thousand, because it is where MSC intersects D=MSB.
- Q=15 thousand, because it is where S=MPC intersects the quantity axis.
Explanation: This question tests your understanding of externalities and efficiency in markets with negative externalities. A negative externality occurs when production or consumption imposes costs on third parties not involved in the transaction, while a positive externality creates benefits; here, ride-sharing trips increase traffic congestion for other drivers, making the marginal social cost (MSC) higher than the marginal private cost (MPC). The graph shows MSC above the supply curve (S=MPC), indicating the true cost to society exceeds what ride-sharing companies consider. The socially optimal quantity occurs where marginal social cost equals marginal social benefit (MSC = MSB), which happens at Q = 15 thousand trips where these curves intersect (since there's no consumption externality, MSB = D=MPB). A common misconception is that the market equilibrium (where S=MPC intersects D=MPB at Q = 25 thousand) represents the efficient outcome, but this ignores the congestion costs imposed on others. To find the efficient quantity with any externality, locate where MSC intersects MSB. This transferable strategy ensures you account for all social costs and benefits when determining the optimal production level.
Question 16
A market for public art installations creates spillover benefits such as increased tourism and neighborhood enjoyment (a positive externality). Based on the externality shown in the graph, is the market outcome socially efficient?
- No; the market equilibrium overproduces because MSB lies above D=MPB, so Qmarket>Q∗.
- Yes; the market equilibrium is efficient because MSB and D=MPB intersect at the market quantity.
- No; the market equilibrium underproduces because MSB lies above D=MPB, so Qmarket<Q∗. (correct answer)
- Yes; the market equilibrium is efficient because S=MPC intersects D=MPB at the socially optimal quantity.
- No; the market equilibrium is inefficient because MSC lies above S=MPC, so Qmarket>Q∗.
Explanation: This question tests your understanding of externalities and efficiency by asking whether a market with positive externalities achieves social efficiency. A positive externality occurs when production or consumption creates benefits for third parties (here, public art increasing tourism and neighborhood enjoyment), while a negative externality imposes costs; this makes the marginal social benefit (MSB) higher than the marginal private benefit (MPB). The graph shows MSB lying above D=MPB, indicating that the true benefit to society exceeds what art buyers consider in their decisions. The market equilibrium occurs where S=MPC intersects D=MPB, but the socially optimal quantity occurs where MSC (which equals S=MPC when there's no production externality) intersects MSB—since MSB > MPB at the market quantity, the market underproduces relative to the social optimum (Qmarket < Q*). A common misconception is that the market equilibrium automatically achieves the socially optimal outcome, but positive externalities cause markets to produce too little. To determine efficiency with externalities, compare where private curves intersect (market outcome) to where social curves intersect (efficient outcome). When MSB exceeds MPB, the market underproduces because buyers don't capture all the social benefits.
Question 17
A market for fireworks creates noise and air pollution that affects bystanders (a negative externality). Based on the externality shown in the graph, which quantity is socially optimal (in thousands of fireworks packs)?
- Q=12 thousand, where S=MPC intersects D=MPB.
- Q=8 thousand, where MSC intersects D=MSB. (correct answer)
- Q=16 thousand, where MSC intersects D=MSB.
- Q=10 thousand, where MSC intersects S=MPC.
- Q=12 thousand, where MSC intersects D=MSB.
Explanation: This question tests your understanding of externalities and efficiency in markets with negative externalities. A negative externality occurs when production or consumption imposes costs on third parties not involved in the transaction, while a positive externality creates benefits; here, fireworks create noise and air pollution affecting bystanders, making the marginal social cost (MSC) higher than the marginal private cost (MPC). The graph shows MSC above the supply curve (S=MPC), indicating the true cost to society exceeds what firework sellers consider. The socially optimal quantity occurs where marginal social cost equals marginal social benefit (MSC = MSB), which happens at Q = 8 thousand packs where these curves intersect (since there's no consumption externality, MSB = D=MPB). A common misconception is that the market equilibrium (where S=MPC intersects D=MPB at Q = 12 thousand) represents the efficient outcome, but this ignores the external costs imposed on bystanders. To find the efficient quantity with any externality, locate where MSC intersects MSB. When negative externalities exist, the socially optimal quantity will be less than the market quantity because the true social cost exceeds the private cost.
Question 18
A market for beekeeping services (renting hives to pollinate nearby farms) is shown. Pollination benefits nearby crop growers who do not pay the beekeeper, creating a positive externality. Based on the externality shown in the graph, is the market outcome socially efficient?
- Yes; the market outcome is efficient because MSB equals MPB
- No; the market overproduces because MSB lies above MPB, so Qm>Q∗
- No; the market underproduces because MSB lies above MPB, so Qm<Q∗ (correct answer)
- Yes; the market outcome is efficient because MSC lies above MPC
- No; the efficient quantity is where MPC intersects MPB
Explanation: This question tests your understanding of externalities and efficiency in markets. A positive externality occurs when production provides uncompensated benefits to third parties, like pollination, while a negative externality imposes costs; marginal social benefit (MSB) equals marginal private benefit (MPB) plus external benefits, and marginal social cost (MSC) equals marginal private cost (MPC) plus external costs. The graph shows the MSB curve above the D=MPB demand curve due to the beekeeping externality, with supply as S=MPC=MSC. The market outcome is not socially efficient because it underproduces, as MSB lies above MPB leading to Qm < Q* where additional units would yield net social gains. A common misconception is that the market equilibrium equals the social optimum, but positive externalities cause inefficiency through underproduction ignoring external benefits. To analyze similar problems, compare MSC to MSB on the graph. The efficient outcome occurs where MSC equals MSB.
Question 19
A city's market for electricity is shown in the graph. Electricity generation creates air pollution, imposing an external cost on nearby residents. Based on the externality shown in the graph, what is the socially optimal quantity of electricity?
(Use the graph: the market equilibrium is where S=MPC intersects D=MPB, and the socially efficient outcome is where MSC intersects D=MSB.)
- Q=20 units, because it is where S=MPC intersects D=MPB
- Q=30 units, because it is where MSC intersects D=MPB
- Q=20 units, because it is where MSC intersects D=MSB
- Q=30 units, because it is where MSC intersects D=MSB (correct answer)
- Q=40 units, because it is where S=MPC intersects MSC
Explanation: This question tests your understanding of externalities and efficiency in markets. A negative externality occurs when production imposes uncompensated costs on third parties, like air pollution, while a positive externality provides uncompensated benefits; marginal social cost (MSC) equals marginal private cost (MPC) plus external costs, and marginal social benefit (MSB) equals marginal private benefit (MPB) plus external benefits. The graph shows the MSC curve above the S=MPC supply curve due to the pollution externality, with demand as D=MPB and D=MSB. The socially optimal quantity is Q=30 units, because it is where MSC intersects D=MSB, equating full societal costs and benefits for maximum welfare. A common misconception is that the market equilibrium equals the social optimum, but negative externalities cause overproduction as private costs ignore external harms. To analyze similar problems, compare MSC to MSB on the graph. The efficient outcome occurs where MSC equals MSB.
Question 20
A market for fireworks is shown in the graph. Fireworks create noise and air pollution that harms nonbuyers, a negative externality. Based on the externality shown in the graph, is the market outcome socially efficient?
- Yes; the market outcome is efficient because D=MPB reflects all benefits
- No; the market underproduces because MSC lies above MPC, so Qm<Q∗
- No; the market overproduces because MSC lies above MPC, so Qm>Q∗ (correct answer)
- Yes; the market outcome is efficient because Qm is where MSC intersects MSB
- No; efficiency requires setting Q where MPC intersects MPB
Explanation: This question tests your understanding of externalities and efficiency in markets. A negative externality occurs when consumption imposes uncompensated costs on third parties, like noise and pollution from fireworks, while a positive externality provides benefits; marginal social cost (MSC) equals marginal private cost (MPC) plus external costs, and marginal social benefit (MSB) equals marginal private benefit (MPB) plus external benefits. The graph shows the MSC curve above the S=MPC supply curve due to the fireworks externality, with demand as D=MPB=MSB. The market outcome is not socially efficient because it overproduces, as MSC lies above MPC leading to Qm > Q* where social costs exceed benefits beyond the optimum. A common misconception is that the market equilibrium equals the social optimum, but negative externalities cause inefficiency through overproduction ignoring external costs. To analyze similar problems, compare MSC to MSB on the graph. The efficient outcome occurs where MSC equals MSB.