Effects of Government Intervention in Markets
Help Questions
AP Microeconomics › Effects of Government Intervention in Markets
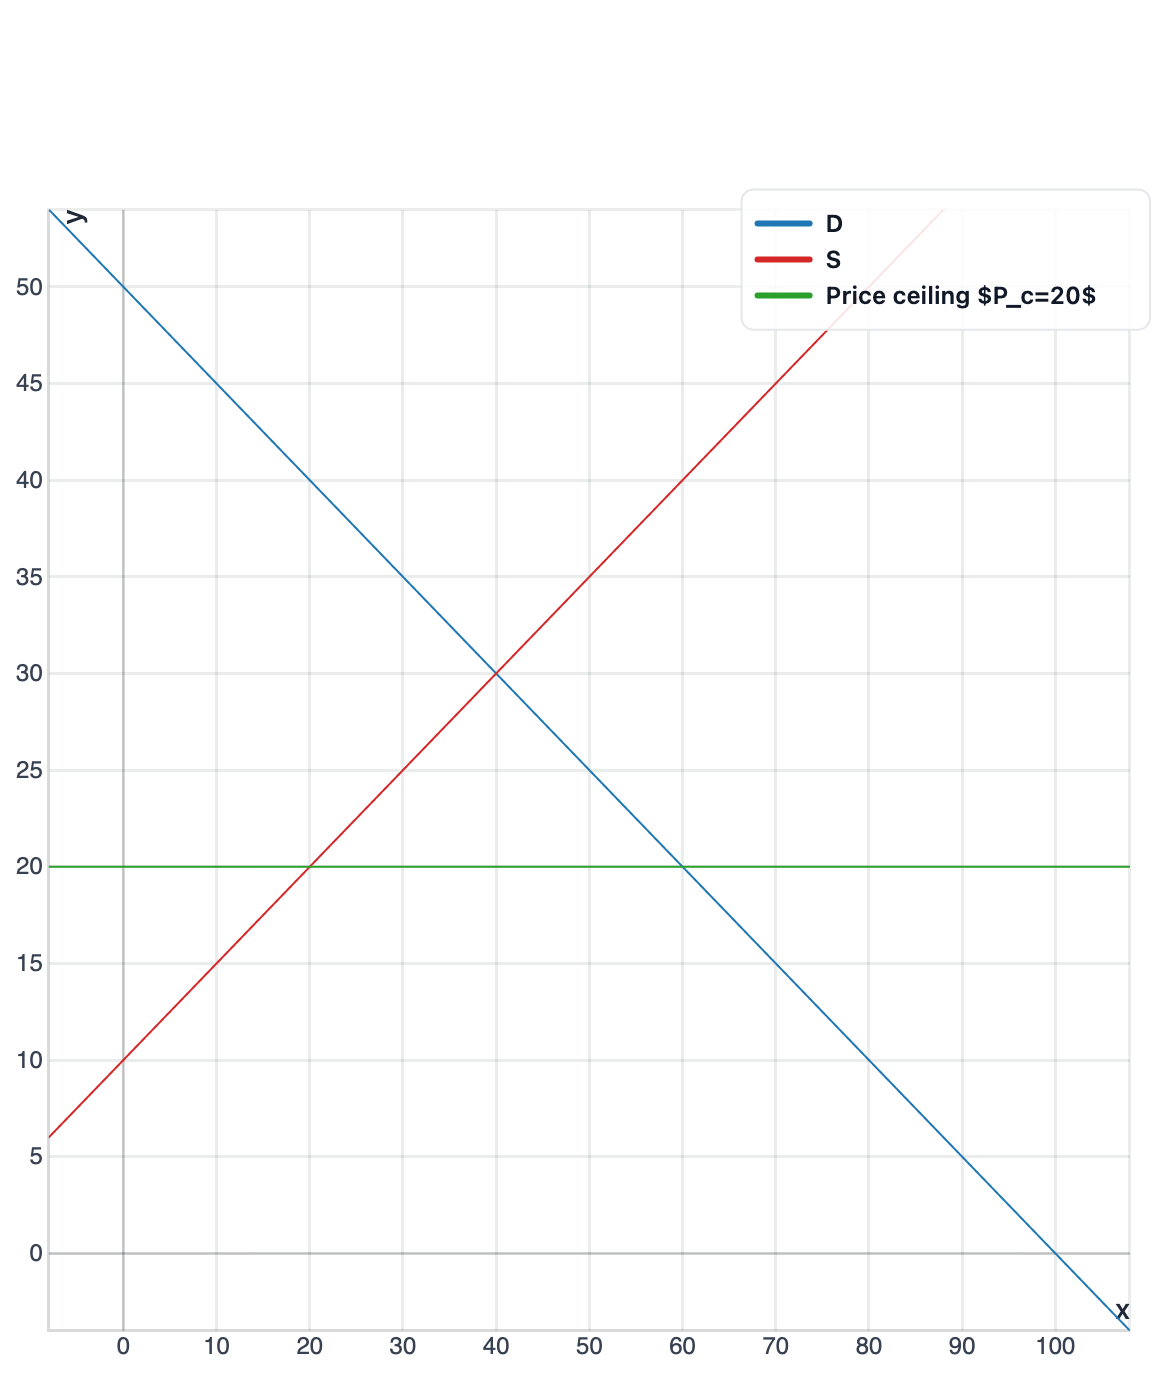
In the market for rental apartments, the city imposes a price ceiling of $P_c = $20 per month. Based on the market graph shown, does the policy create a shortage or surplus, and of what size?
A shortage of 20 apartments
A surplus of 20 apartments
A shortage of 40 apartments
A surplus of 40 apartments
No shortage or surplus because the ceiling is non-binding
Explanation
This question tests your ability to analyze the effects of government intervention in markets, specifically a price ceiling on rental apartments. A price ceiling is a legal maximum price set below the equilibrium price, preventing the market from reaching its natural clearing point. When the ceiling at $20 is binding (below equilibrium), the graph shows quantity demanded exceeds quantity supplied at that price level. Reading from the graph at P=$20, we find Qd=60 apartments demanded but only Qs=20 apartments supplied, creating a shortage of 40 apartments (60-20=40), making answer A correct. A common misconception is confusing shortages with surpluses—remember that ceilings create shortages because the low price attracts many buyers but discourages sellers. To solve these problems systematically, first check if the intervention is binding (ceiling below equilibrium or floor above equilibrium), then read the quantities from the graph at the regulated price. The difference between quantity demanded and quantity supplied gives you the shortage (if Qd>Qs) or surplus (if Qs>Qd).
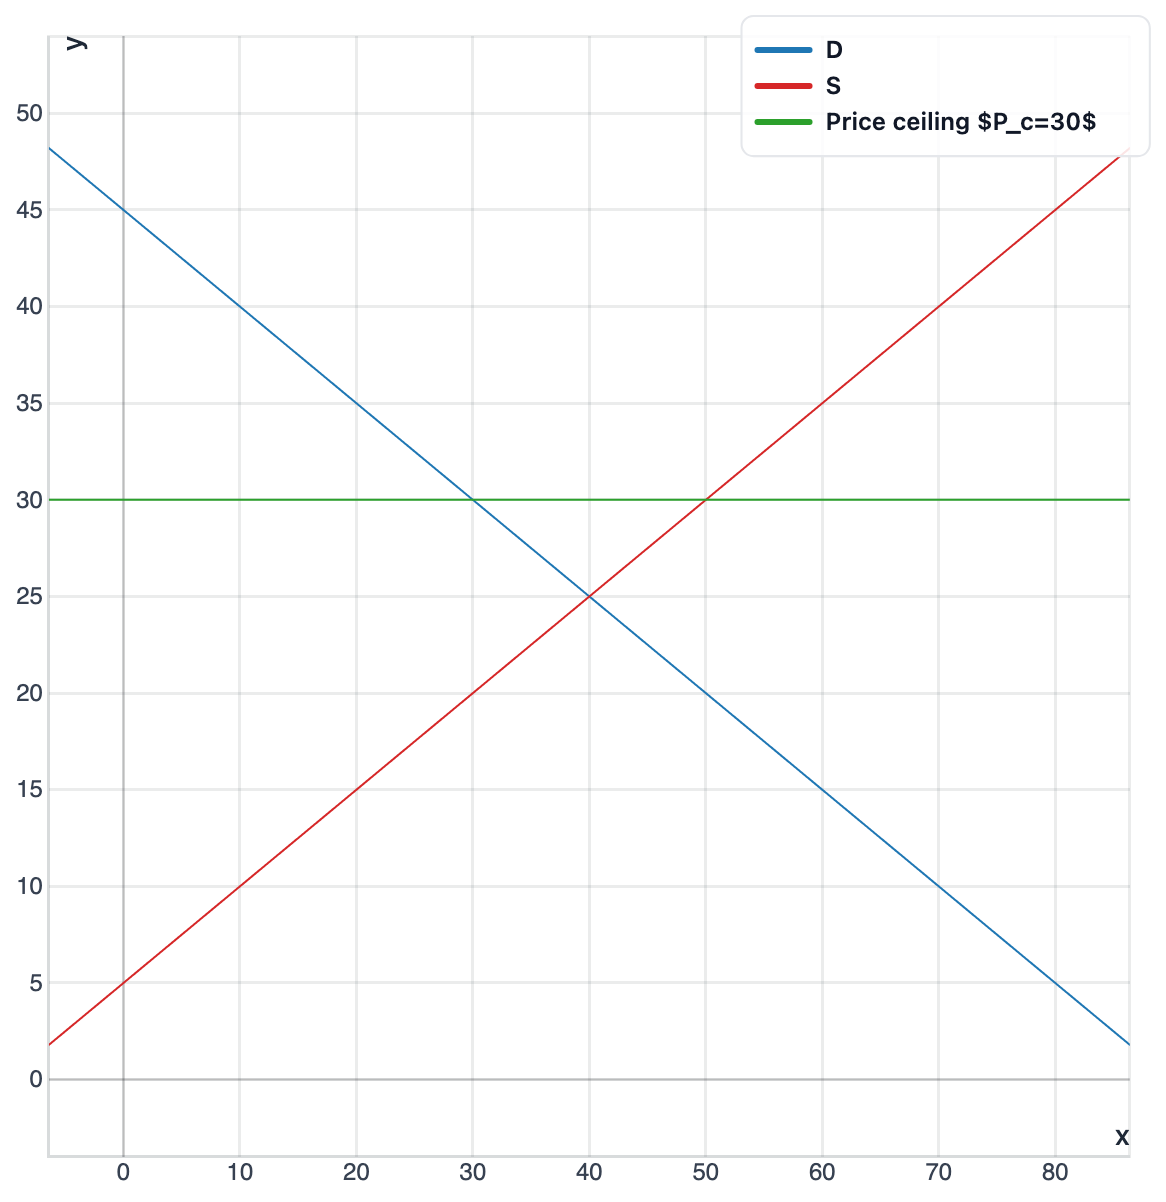
In the market for concert tickets, the government imposes a price ceiling of $P_c = $30. Based on the market graph shown, does the policy create a shortage or surplus, and of what size?
A surplus of 10 tickets
A surplus of 20 tickets
A shortage of 20 tickets
A shortage of 10 tickets
No shortage or surplus because the ceiling is non-binding
Explanation
This question tests your ability to analyze the effects of government intervention in markets, specifically a price ceiling on concert tickets. A price ceiling is a legal maximum price that only creates market distortions when set below the equilibrium price. Looking at the graph, if the equilibrium price is already at or below $30, then the ceiling at $30 is non-binding and allows the market to operate freely at its natural equilibrium. Since the ceiling doesn't prevent the market from clearing at its equilibrium price, there is no shortage or surplus created, making answer D correct. A common misconception is assuming all price ceilings create shortages—but this only occurs when the ceiling is binding (set below equilibrium price). To analyze price controls systematically, always compare the control price to the equilibrium price first: a ceiling at $30 has no effect if equilibrium is at $25, for example. When non-binding, the market continues to operate at the intersection of supply and demand where quantity supplied equals quantity demanded.
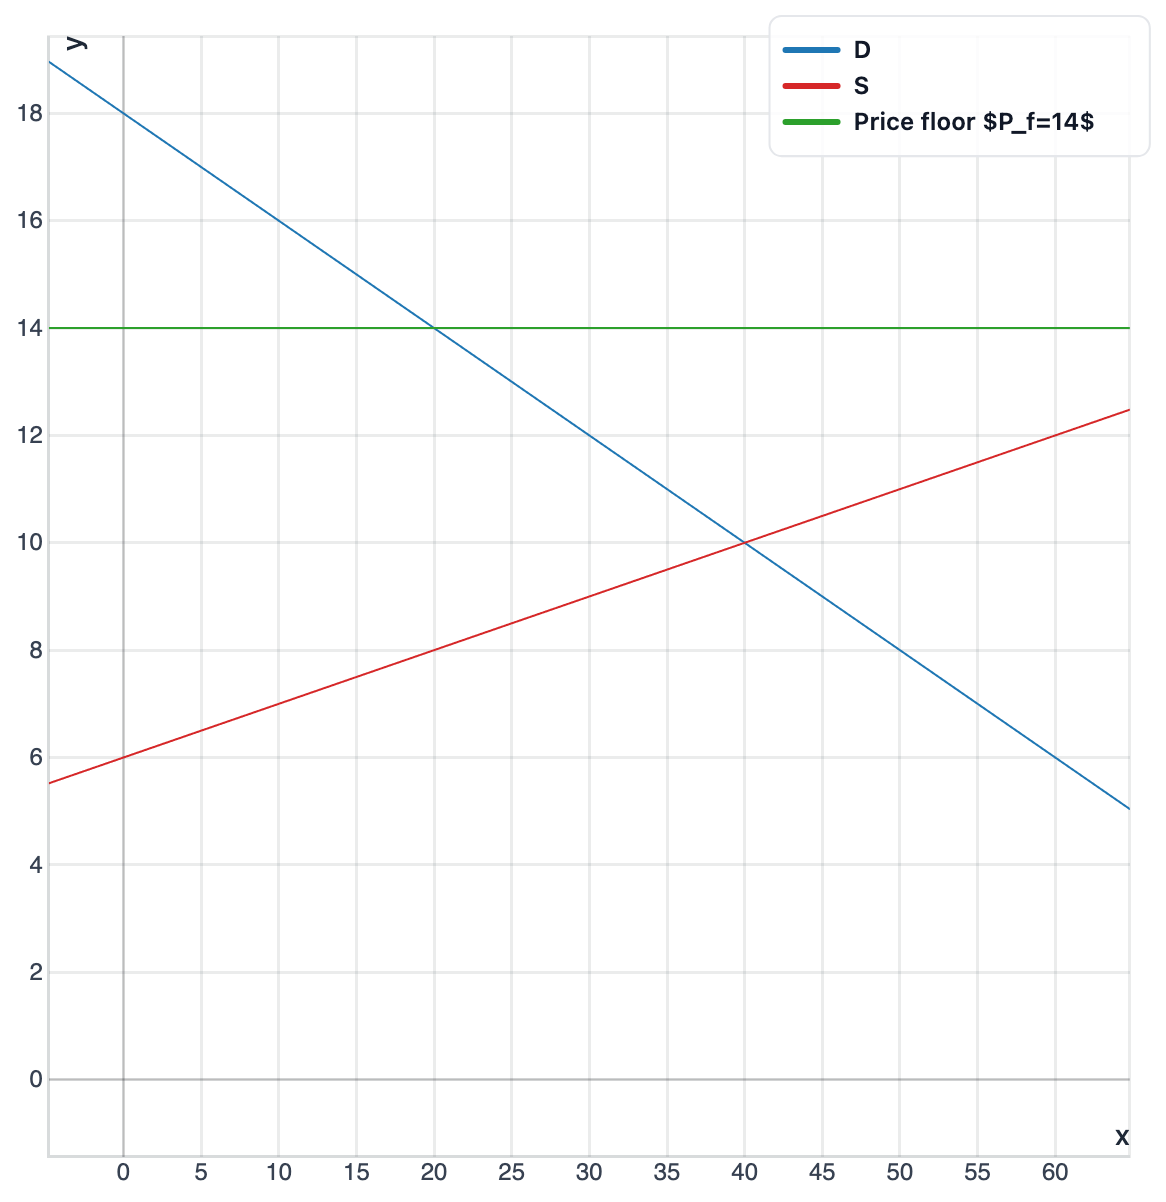
In the market for wheat, the government imposes a price floor of $P_f = $14 per bushel. Based on the market graph shown, does the policy create a shortage or surplus, and of what size?
No shortage or surplus because the floor is non-binding
A surplus of 20 bushels
A shortage of 10 bushels
A surplus of 10 bushels
A shortage of 20 bushels
Explanation
This question tests your ability to analyze the effects of government intervention in markets, specifically a price floor on wheat. A price floor is a legal minimum price that prevents the market price from falling below a specified level. When the floor at $14 is binding (set above the equilibrium price), it creates a situation where producers want to supply more wheat at this higher price while consumers demand less. Reading from the graph at P=$14, we can see that quantity supplied exceeds quantity demanded by 20 bushels, creating a surplus of 20 bushels, making answer A correct. A common misconception is confusing the effects of floors and ceilings—remember that binding price floors always create surpluses because the high price encourages excess production while discouraging consumption. To solve these problems efficiently, first verify the floor is binding (above equilibrium), then read the quantities directly from the graph at the floor price. The surplus equals the horizontal distance between the supply and demand curves at the floor price, representing unsold inventory that accumulates in the market.
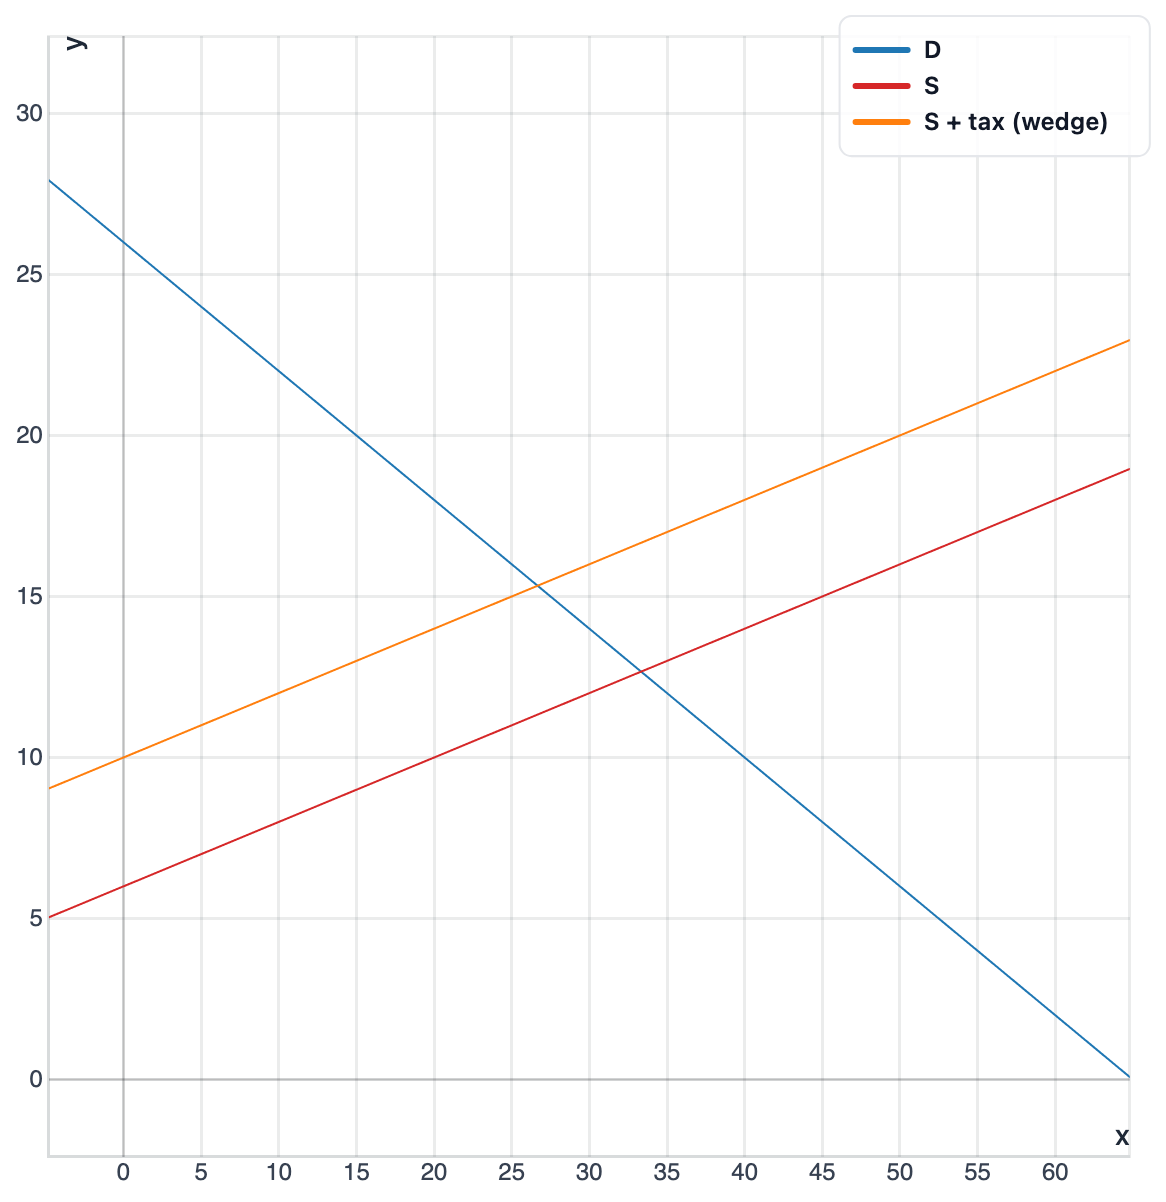
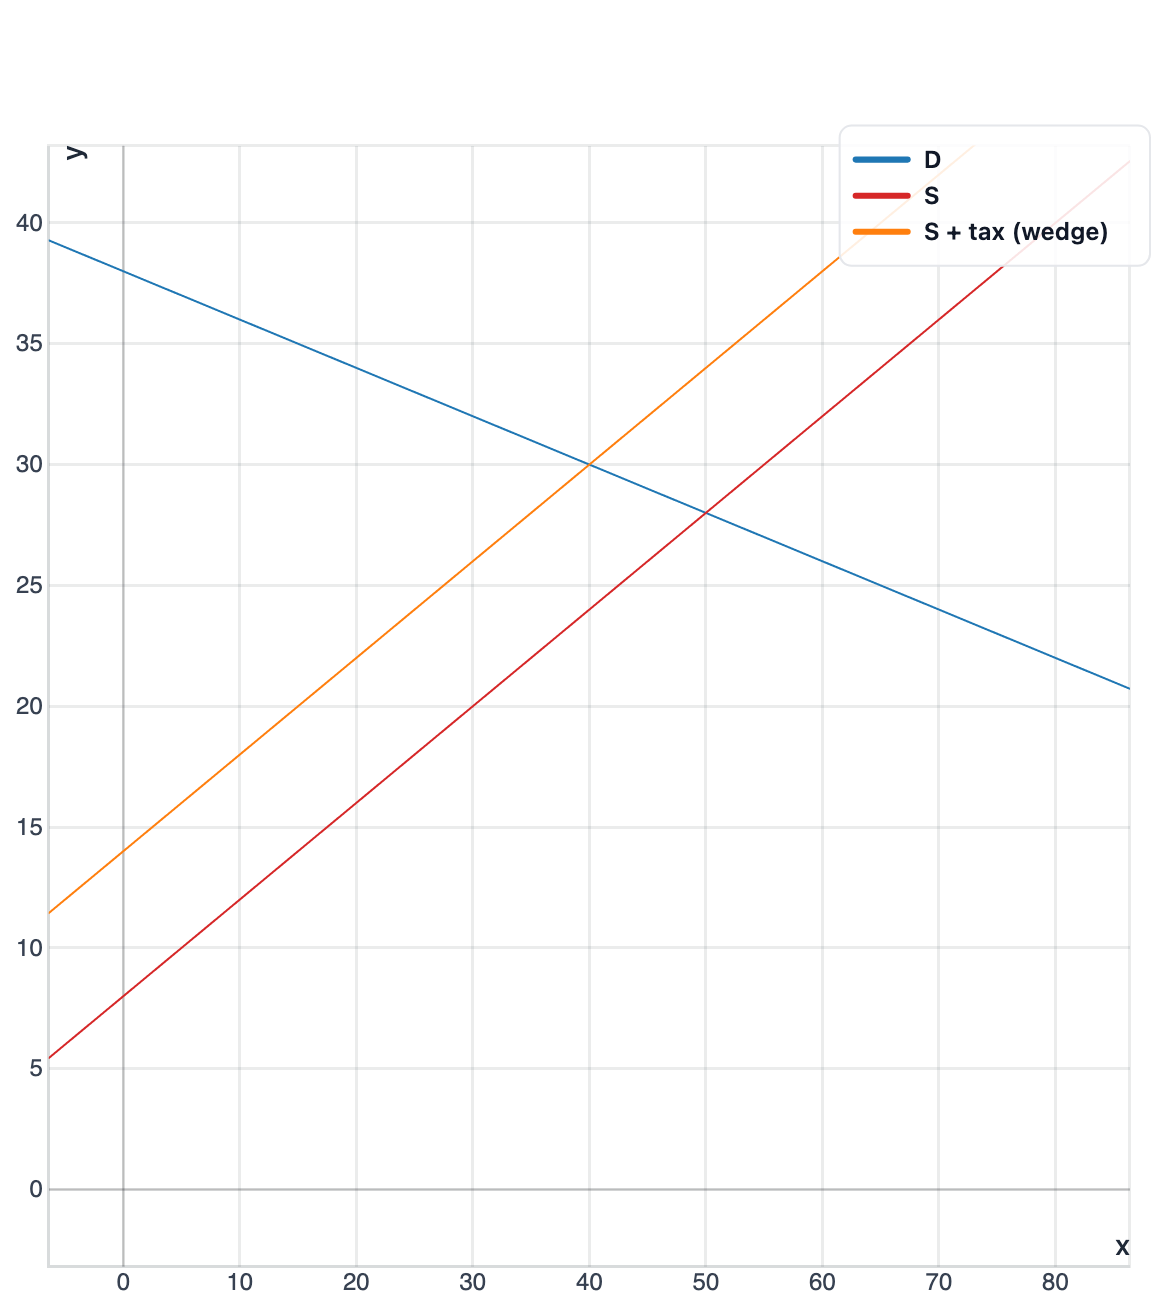
In the market for ride-sharing trips, the government imposes a per-unit tax of $t = $8. Based on the market graph shown, what is the price paid by consumers and the price received by producers after the tax?

Consumers pay $26 and producers receive $18
Consumers pay $20 and producers receive $12
Consumers pay $22 and producers receive $14
Consumers pay $24 and producers receive $16
Consumers pay $28 and producers receive $20
Explanation
This question tests your ability to analyze the effects of government intervention in markets, specifically a per-unit tax on ride-sharing trips. A per-unit tax of $8 creates a vertical wedge between what consumers pay and what producers receive, with the government collecting the difference. The tax effectively shifts the supply curve upward by $8, creating a new equilibrium at a lower quantity where the vertical distance between the original supply and demand curves equals the tax amount. Reading from the graph at this new equilibrium quantity, consumers pay $22 (the price on the demand curve) while producers receive $14 (exactly $8 less than what consumers pay), making answer D correct. A common misconception is adding the full tax to the original equilibrium price—but both sides typically share the burden, with the consumer price rising by less than the full tax amount. To solve tax problems systematically, find where the vertical gap between the original curves equals the tax amount, then read the consumer price from the demand curve and subtract the tax to get the producer price. The difference between what consumers pay and producers receive always equals the per-unit tax.
In the market for bottled water, the government imposes a per-unit tax of $$t = $$$4.$ Based on the market graph shown, who bears more of the tax burden?
Consumers bear more of the tax burden
Producers bear the entire tax burden
Consumers bear the entire tax burden
Producers bear more of the tax burden
Consumers and producers bear equal tax burdens
Explanation
This question tests your ability to analyze the effects of government intervention in markets, specifically who bears more of a per-unit tax burden on bottled water. Tax incidence is determined by the relative price elasticities of supply and demand—whichever side of the market is less elastic (less responsive to price changes) bears the greater burden. Examining the graph, if the supply curve is steeper (more inelastic) than the demand curve, producers will bear more of the $4 tax burden because they cannot easily adjust their quantity supplied when their net price falls. Since bottled water has many substitutes (tap water, other beverages) making demand relatively elastic, while short-run supply may be constrained by production capacity, producers bear the larger share of the tax burden, making answer B correct. A common misconception is assuming consumers always bear most of the tax burden—but when demand is elastic and supply is inelastic, producers absorb more of the tax. To analyze tax incidence systematically, compare curve slopes: the steeper curve represents the more inelastic side that bears more burden. Products with many substitutes typically have elastic demand, shifting more tax burden to producers when supply is relatively inelastic.
In the market for gasoline, the government imposes a per-unit tax of $t = $6. Based on the market graph shown, who bears more of the tax burden?
Producers bear more of the tax burden
Consumers bear more of the tax burden
Producers bear the entire tax burden
Consumers and producers bear equal tax burdens
Consumers bear the entire tax burden
Explanation
This question tests your ability to analyze the effects of government intervention in markets, specifically who bears more of a per-unit tax burden on gasoline. Tax incidence depends on the relative elasticities of supply and demand—the side of the market that is less elastic (less responsive to price changes) bears more of the tax burden. Looking at the graph, if the demand curve is steeper (more inelastic) than the supply curve, consumers will bear more of the $6 tax burden because they cannot easily reduce their quantity demanded when price rises. Since gasoline typically has inelastic demand (few substitutes, necessity for many) while supply is relatively more elastic, consumers bear the larger share of the tax burden, making answer A correct. A common misconception is thinking the statutory incidence (who legally pays the tax) determines the economic incidence—but the burden always depends on relative elasticities regardless of who sends the check to the government. To determine tax incidence, compare the slopes of supply and demand curves: the steeper (more inelastic) side bears more burden. Remember that necessity goods with few substitutes typically have inelastic demand, causing consumers to bear more of any tax imposed.
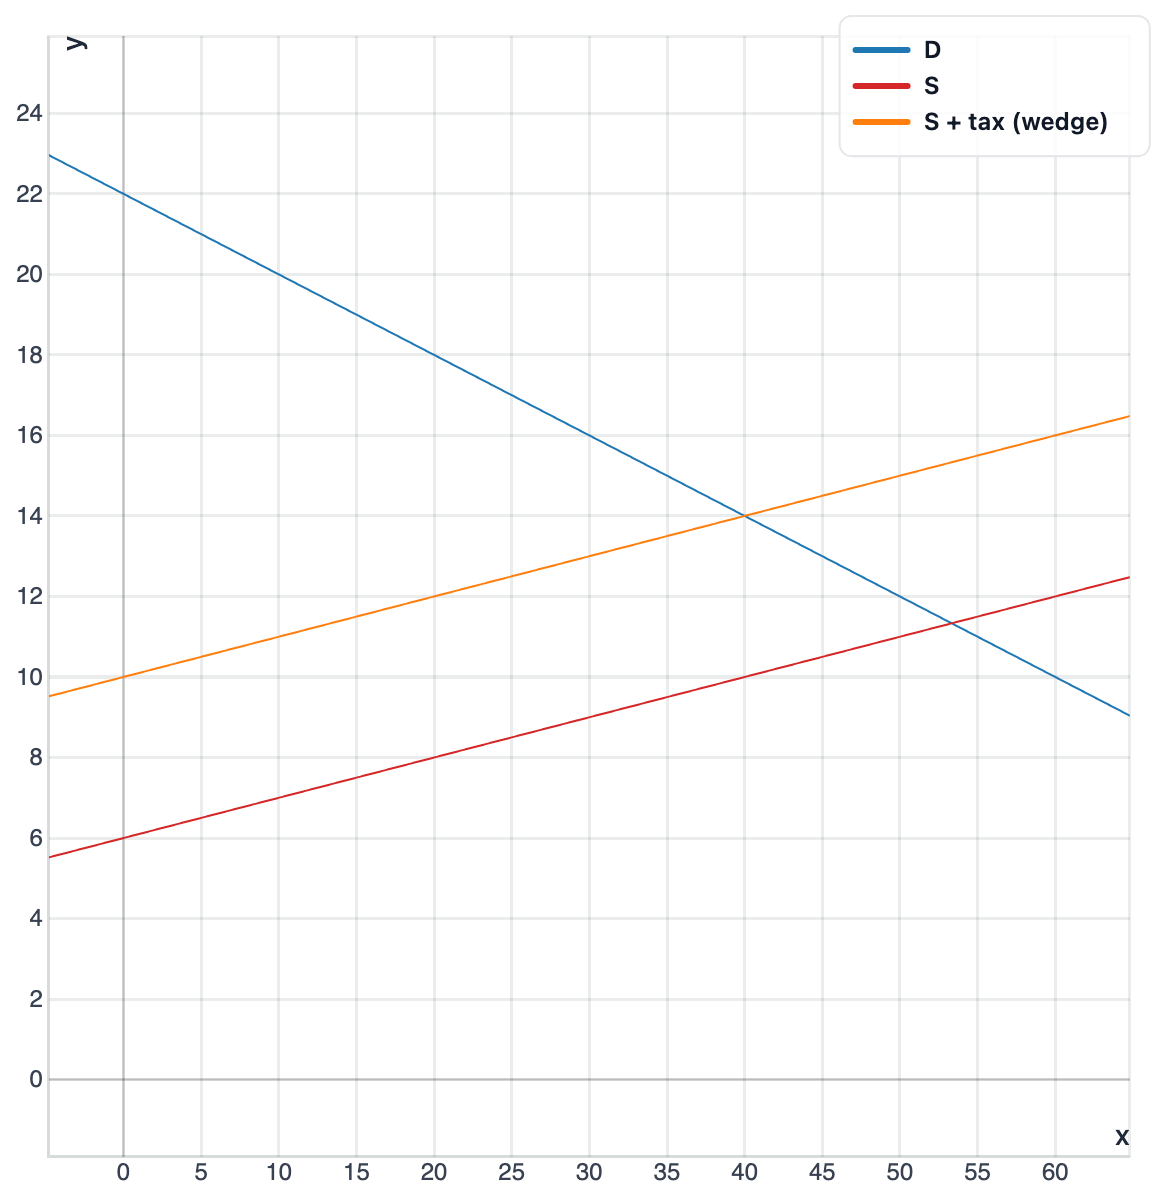
In the market for coffee, the government imposes a per-unit tax of $t = $4. Based on the market graph shown, what is the price paid by consumers and the price received by producers after the tax?
Consumers pay $16 and producers receive $16
Consumers pay $14 and producers receive $10
Consumers pay $18 and producers receive $14
Consumers pay $14 and producers receive $14
Consumers pay $16 and producers receive $12
Explanation
This question tests your ability to analyze the effects of government intervention in markets, specifically a per-unit tax on coffee. A per-unit tax creates a wedge between the price consumers pay and the price producers receive, with the difference equal to the tax amount ($4). The graph shows the tax shifts the supply curve vertically upward by the tax amount, creating a new equilibrium where consumers pay a higher price and producers receive a lower price. Reading from the graph, consumers pay $16 (the price at the new equilibrium on the demand curve) while producers receive $12 (the price $4 below what consumers pay), making answer B correct. A common misconception is thinking the tax burden falls entirely on one side—in reality, both consumers and producers typically share the burden based on their relative elasticities. To solve tax problems, find the new equilibrium quantity where the vertical distance between the original supply and demand curves equals the tax amount. The consumer price is read from the demand curve at this quantity, and the producer price is exactly the tax amount below the consumer price.
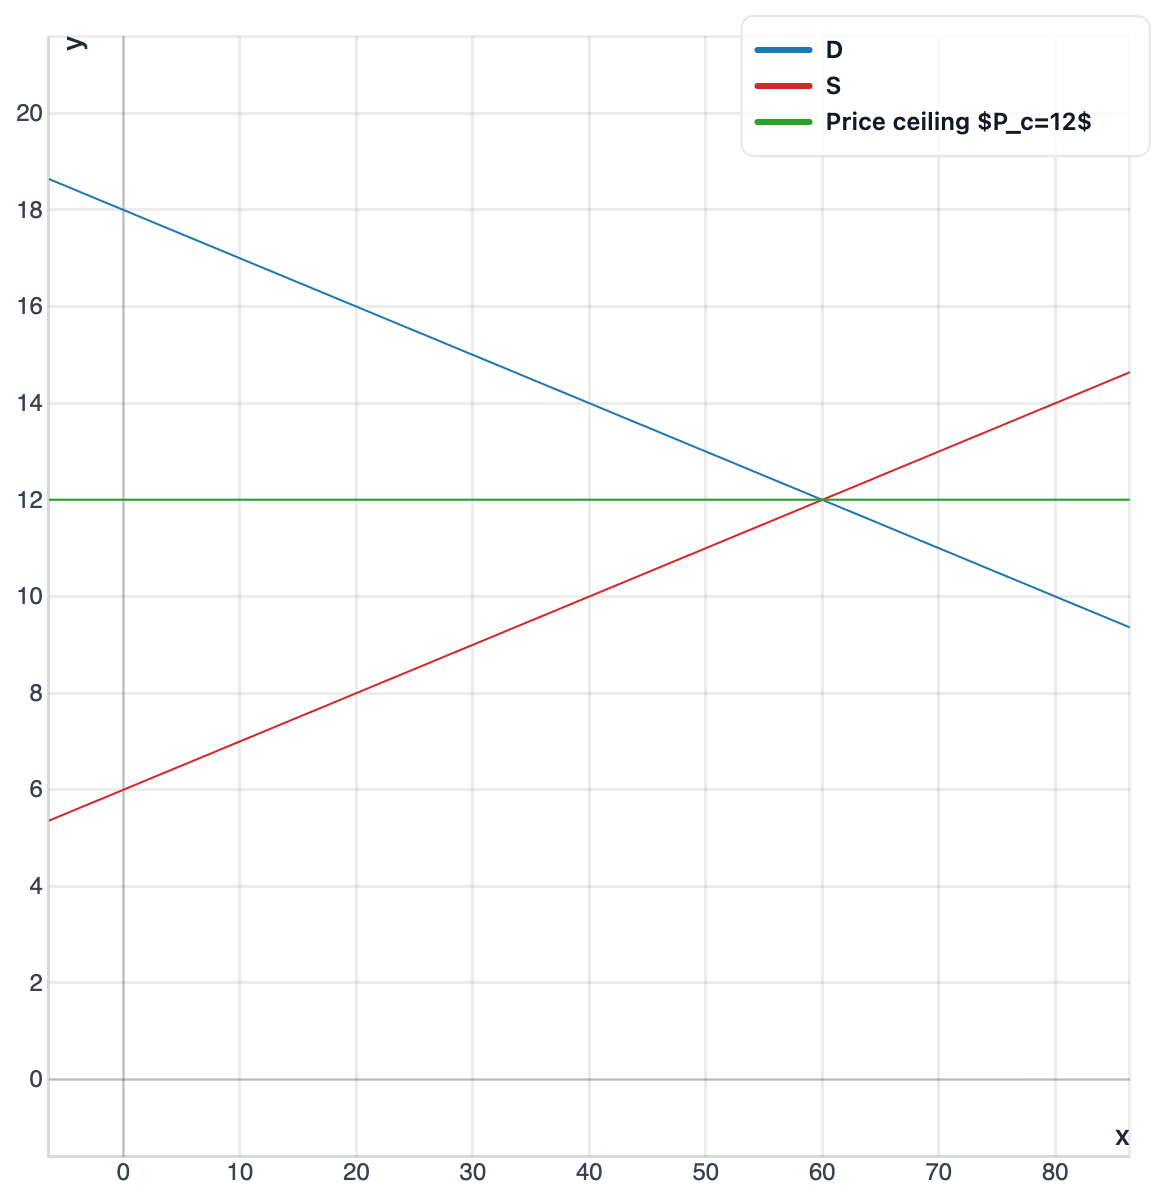
In the market for movie tickets, the city imposes a price ceiling of $P_c = $12. Based on the market graph shown, does the policy create a shortage or surplus, and of what size?
A shortage of 30 tickets
A surplus of 15 tickets
No shortage or surplus because the ceiling is non-binding
A surplus of 30 tickets
A shortage of 15 tickets
Explanation
This question tests your ability to analyze the effects of government intervention in markets, specifically a price ceiling on movie tickets. A price ceiling is a legal maximum price that only affects the market when set below the equilibrium price. Looking at the graph, if the equilibrium price is below $12 (the ceiling price), then the ceiling is non-binding and has no effect on the market. Since the market can freely operate at its equilibrium price below the ceiling, there is no shortage or surplus created, making answer C correct. A common misconception is assuming all price controls create shortages or surpluses—but non-binding controls have no effect because the market price naturally stays within the legal limit. To solve these problems, always compare the control price to the equilibrium price first: ceilings only bind when below equilibrium, floors only bind when above equilibrium. When a control is non-binding, the market operates exactly as it would without intervention, maintaining equilibrium quantity where Qd=Qs.
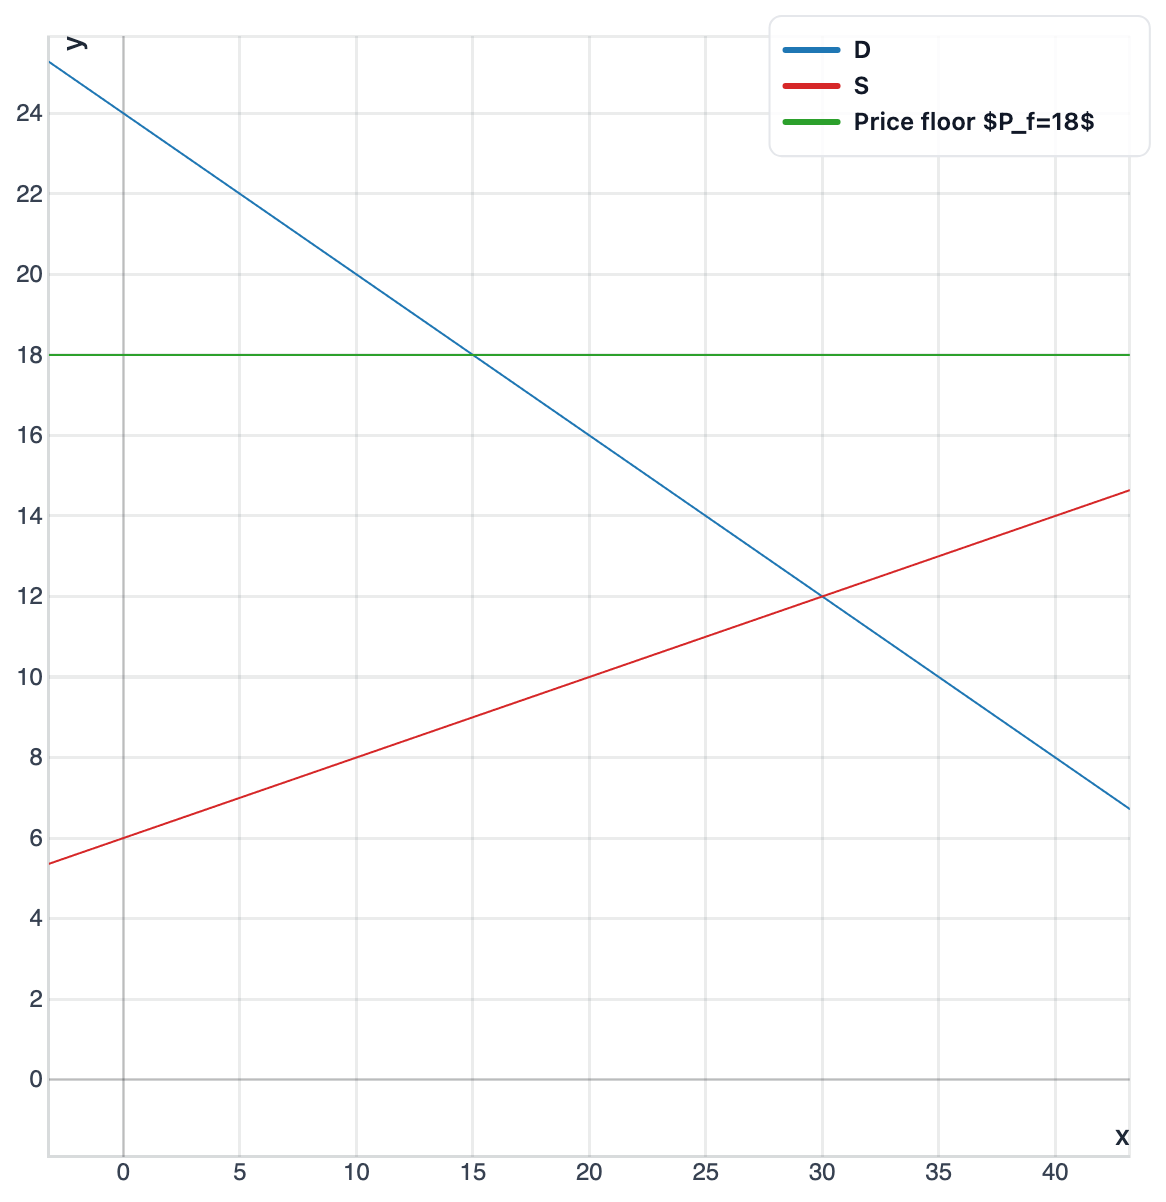
In the market for corn, the government imposes a price floor of $P_f = $18 per bushel. Based on the market graph shown, does the policy create a shortage or surplus, and of what size?
A surplus of 9 bushels
No shortage or surplus because the floor is non-binding
A shortage of 18 bushels
A surplus of 18 bushels
A shortage of 9 bushels
Explanation
This question tests your ability to analyze the effects of government intervention in markets, specifically a price floor on corn. A price floor is a legal minimum price set above the equilibrium price, preventing the market from reaching its natural clearing point. When the floor at $18 is binding (above equilibrium), the graph shows quantity supplied exceeds quantity demanded at that price level. Reading from the graph at P=$18, we find Qs=27 bushels supplied but only Qd=9 bushels demanded, creating a surplus of 18 bushels (27-9=18), making answer B correct. A common misconception is thinking floors create shortages—remember that floors create surpluses because the high price encourages many sellers but discourages buyers. To solve these problems systematically, first verify the floor is binding by checking if it's above the equilibrium price, then read the quantities directly from the graph at the floor price. The surplus equals quantity supplied minus quantity demanded when Qs exceeds Qd.
In the market for milk, the government imposes a price floor of $P_f = $10 per gallon. Based on the market graph shown, does the policy create a shortage or surplus, and of what size?
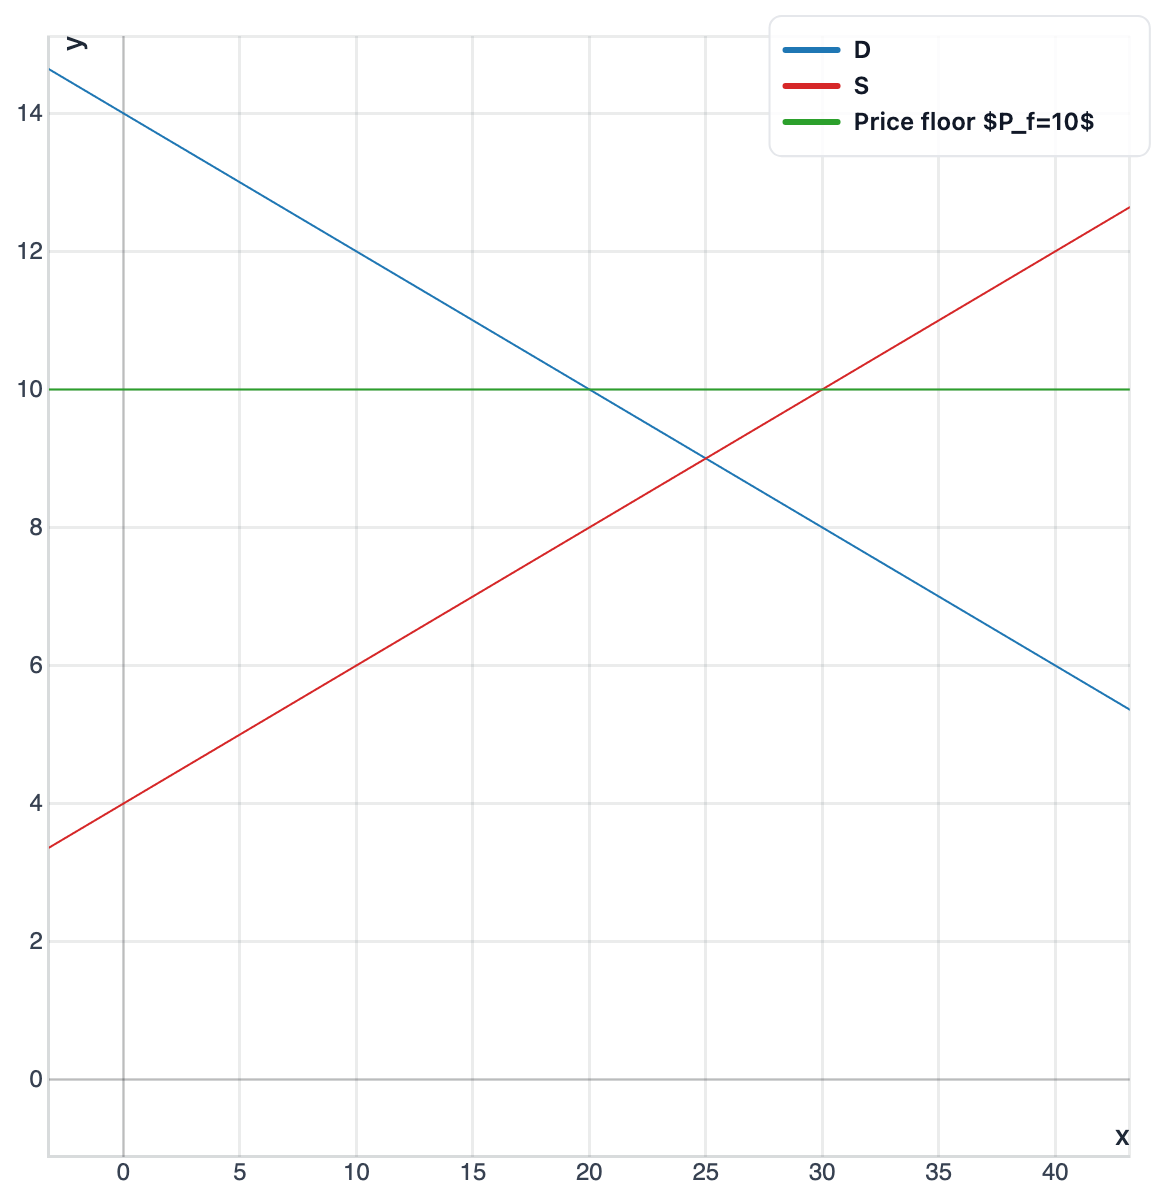
No shortage or surplus because the floor is non-binding
A surplus of 20 gallons
A surplus of 10 gallons
A shortage of 20 gallons
A shortage of 10 gallons
Explanation
This question tests your ability to analyze the effects of government intervention in markets, specifically a price floor on milk. A price floor is a legal minimum price that prevents the market price from falling below a certain level. When the floor at $10 is binding (above the equilibrium price), producers are willing to supply more while consumers demand less at this higher price. Reading from the graph at P=$10, we find Qs=25 gallons supplied but only Qd=15 gallons demanded, creating a surplus of 10 gallons (25-15=10), making answer C correct. A common misconception is calculating the surplus incorrectly—always subtract quantity demanded from quantity supplied (not the reverse) when Qs>Qd. To analyze price floors systematically, first confirm the floor is binding by checking it's above equilibrium, then read the exact quantities from the graph at the floor price. Remember that floors always create surpluses when binding because the artificially high price encourages overproduction while discouraging consumption.