Changes in Factor Demand and Supply
Help Questions
AP Microeconomics › Changes in Factor Demand and Supply
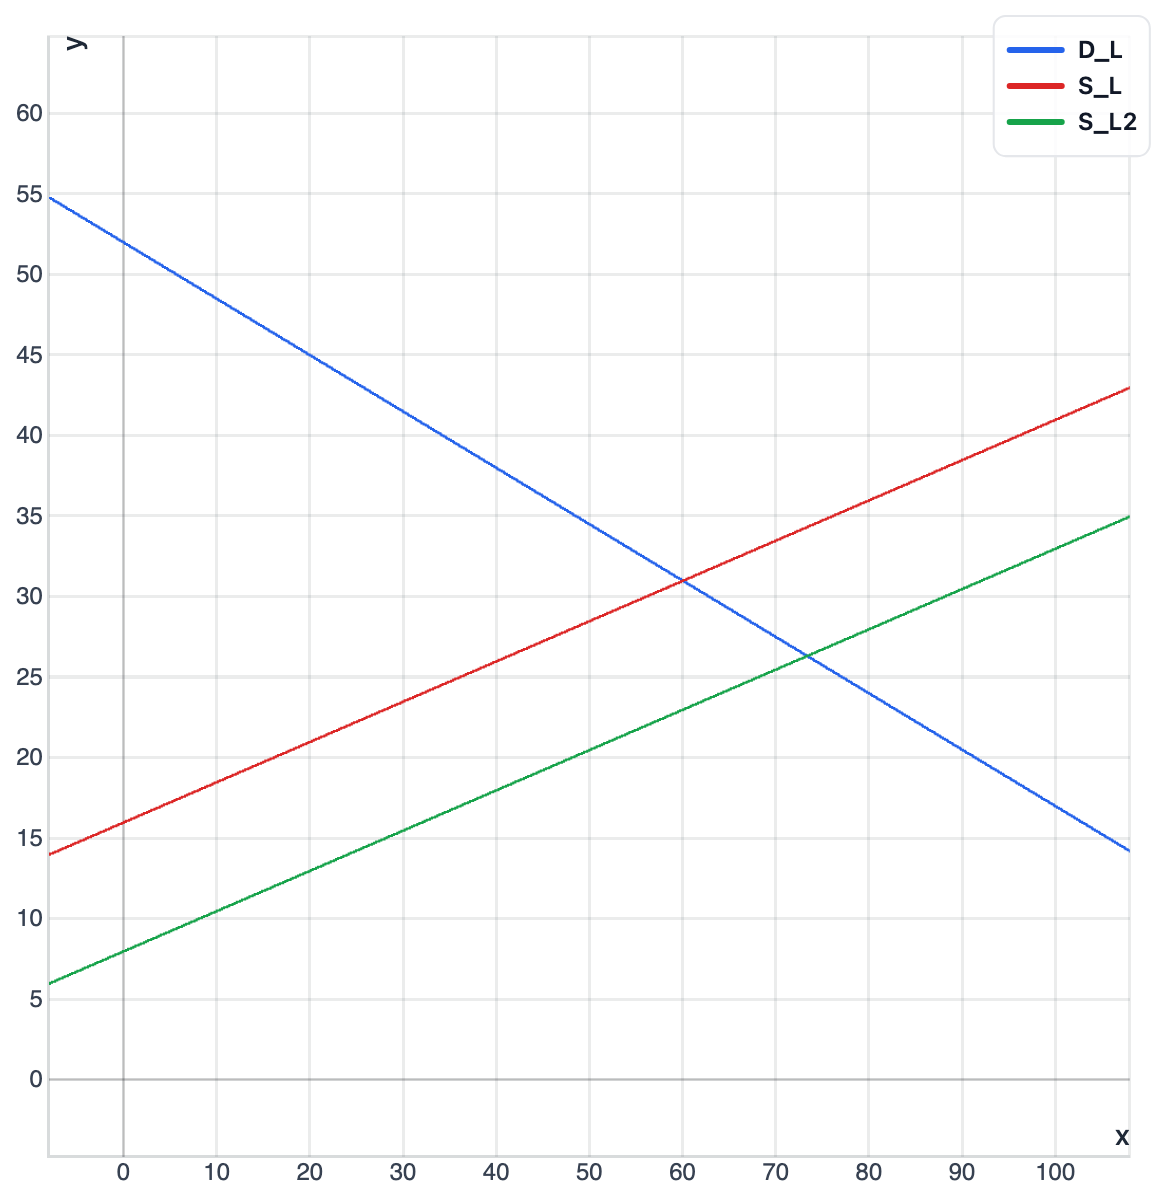
In a competitive labor market for baristas, many workers leave the occupation for higher-paying jobs in another industry, reducing the number of workers willing to work as baristas at each wage. Based on the labor market graph shown, what happens to the equilibrium wage and quantity of labor?
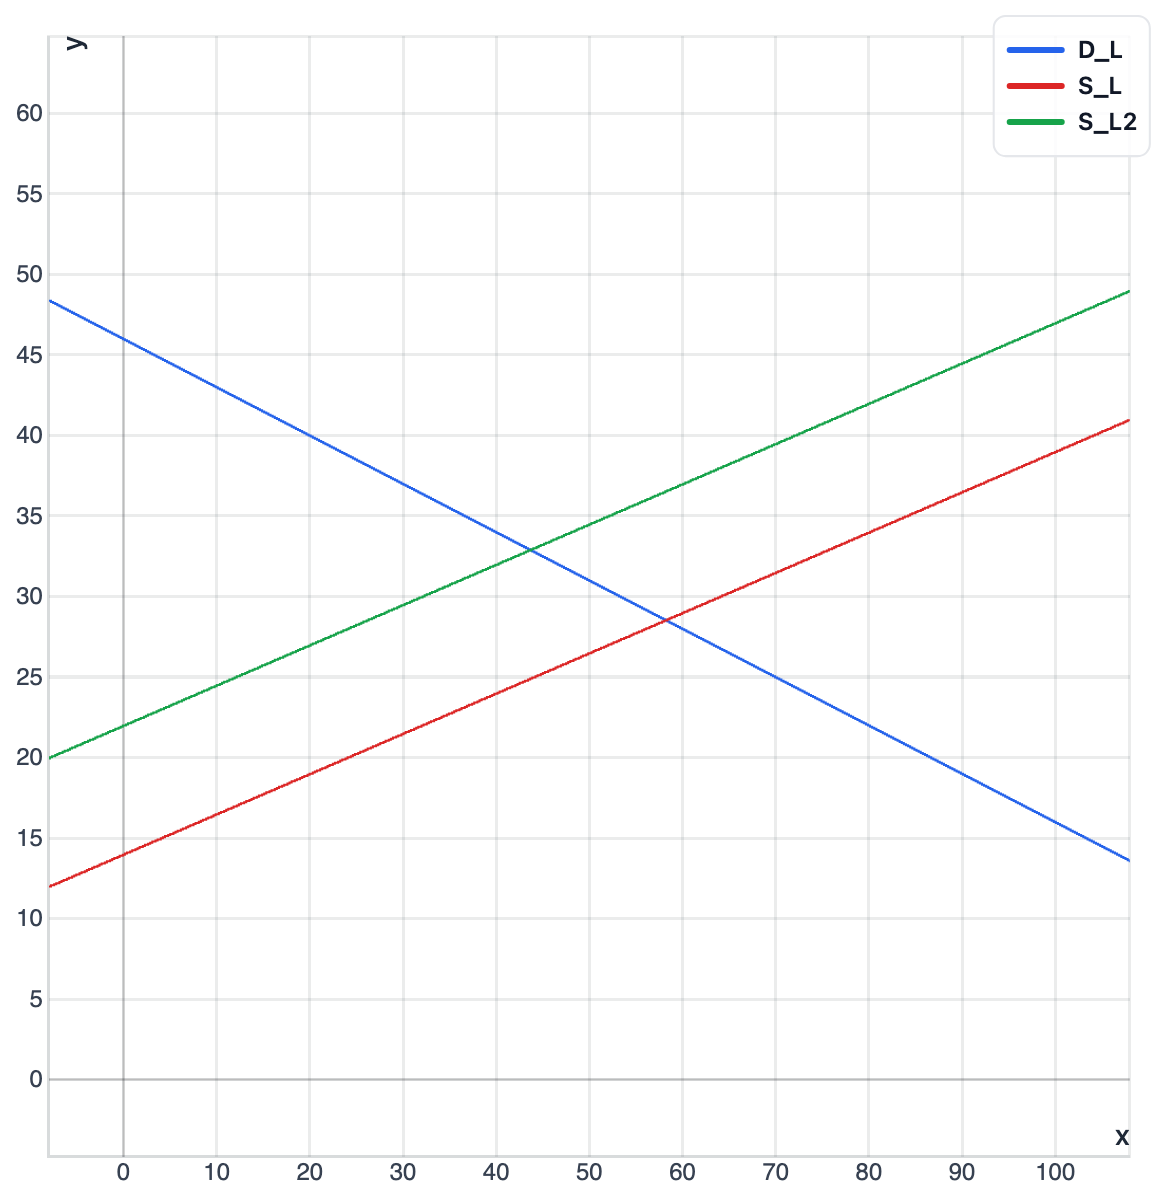
Employment rises because the higher wage causes a movement along labor supply to a larger quantity supplied.
The equilibrium wage increases, and the equilibrium quantity of labor decreases.
The equilibrium wage decreases, and the equilibrium quantity of labor increases.
The equilibrium wage decreases, and the equilibrium quantity of labor decreases.
The equilibrium wage increases, and the equilibrium quantity of labor increases.
Explanation
This question tests your understanding of changes in factor demand and supply, specifically labor supply shifts. Labor demand represents firms' willingness to hire based on worker productivity and output prices, while labor supply shows how many workers are willing to work at different wage levels. When baristas leave for higher-paying jobs elsewhere, the number of workers willing to work as baristas at each wage decreases, causing the labor supply curve to shift left. This leftward shift in labor supply creates a new equilibrium at a higher wage but lower quantity of labor employed. Students often confuse the direction of effects—when workers leave an occupation, wages must rise to attract remaining workers, not fall. The strategy for solving these problems involves identifying which determinant changed (worker preferences shifted away from this occupation), shifting the appropriate curve (supply shifts left), and finding the new equilibrium (higher wage, lower quantity).
In a competitive labor market for warehouse workers, a new immigration program increases the number of workers willing and able to work in the region. Based on the labor market graph shown, what happens to the equilibrium wage and quantity of labor?
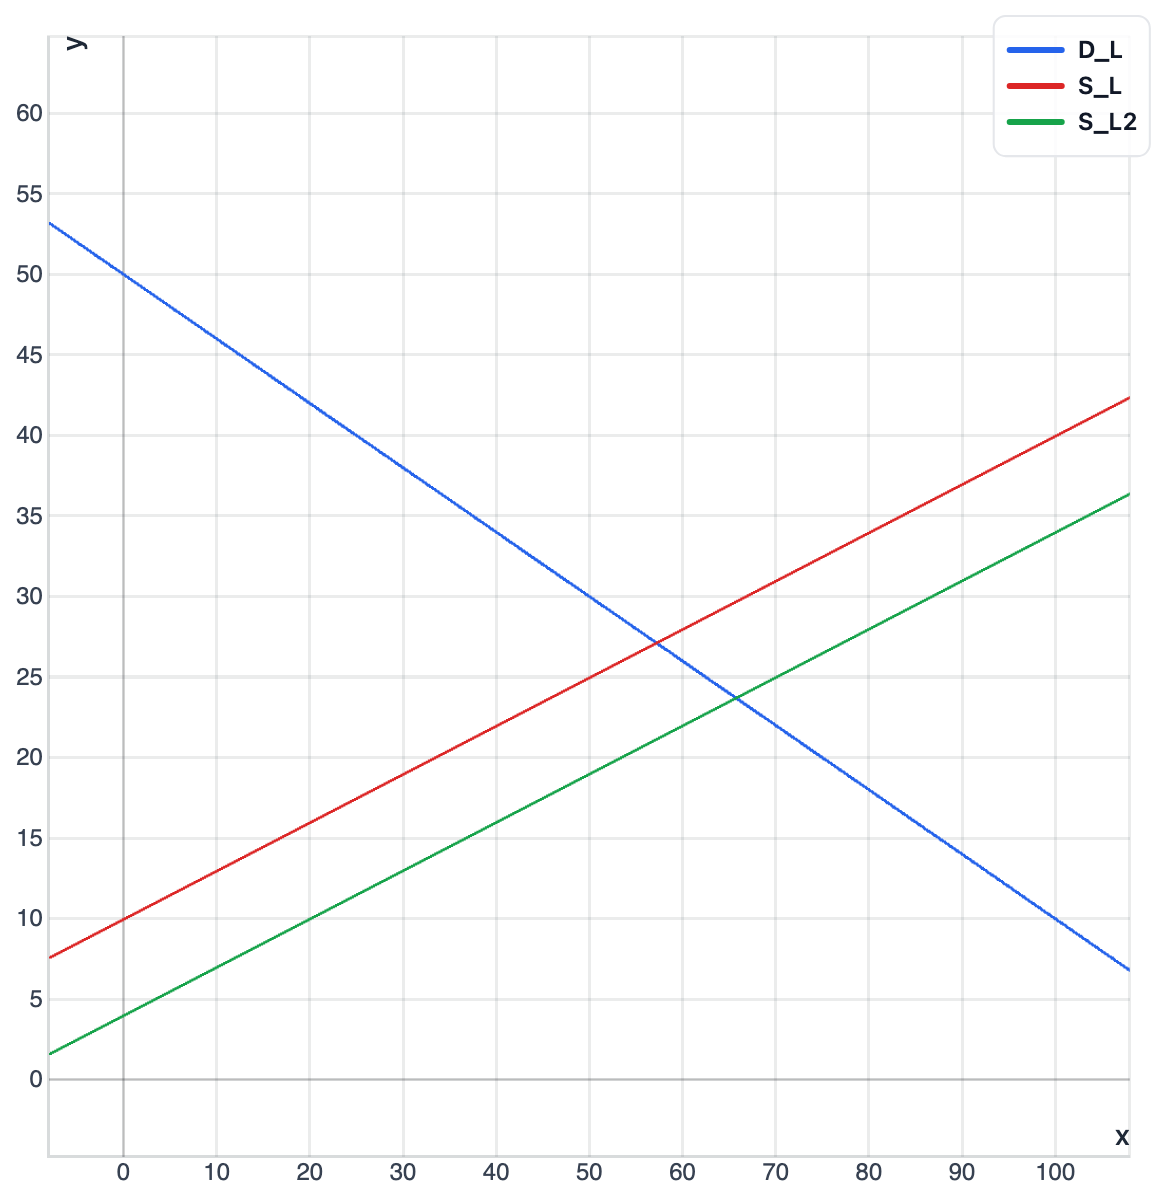
The equilibrium wage increases, and the equilibrium quantity of labor increases.
The equilibrium wage decreases, and the equilibrium quantity of labor increases.
The equilibrium wage decreases, and the equilibrium quantity of labor decreases.
The equilibrium wage increases, and the equilibrium quantity of labor decreases.
The wage changes because of a movement along labor supply rather than a shift, and employment is unchanged.
Explanation
This question examines changes in factor demand and supply, specifically focusing on labor supply shifts. Labor demand reflects firms' willingness to hire based on worker productivity and product prices, while labor supply represents workers' willingness to work at various wage levels. When an immigration program increases the number of available warehouse workers, the labor supply curve shifts right, indicating more workers are willing to work at each wage level. This rightward shift in labor supply leads to a new equilibrium with a lower wage but higher quantity of labor employed. Students often mistakenly think that more workers always means higher wages, but increased supply actually puts downward pressure on wages. The key strategy is to identify which side of the market changed (supply increased), shift that curve in the correct direction (supply shifts right), and trace to the new equilibrium (lower wage, higher quantity).
In a competitive labor market for farm workers, a new harvesting machine allows each worker to pick more crops per hour, increasing the marginal product of labor. Based on the labor market graph shown, what happens to the equilibrium wage and quantity of labor?
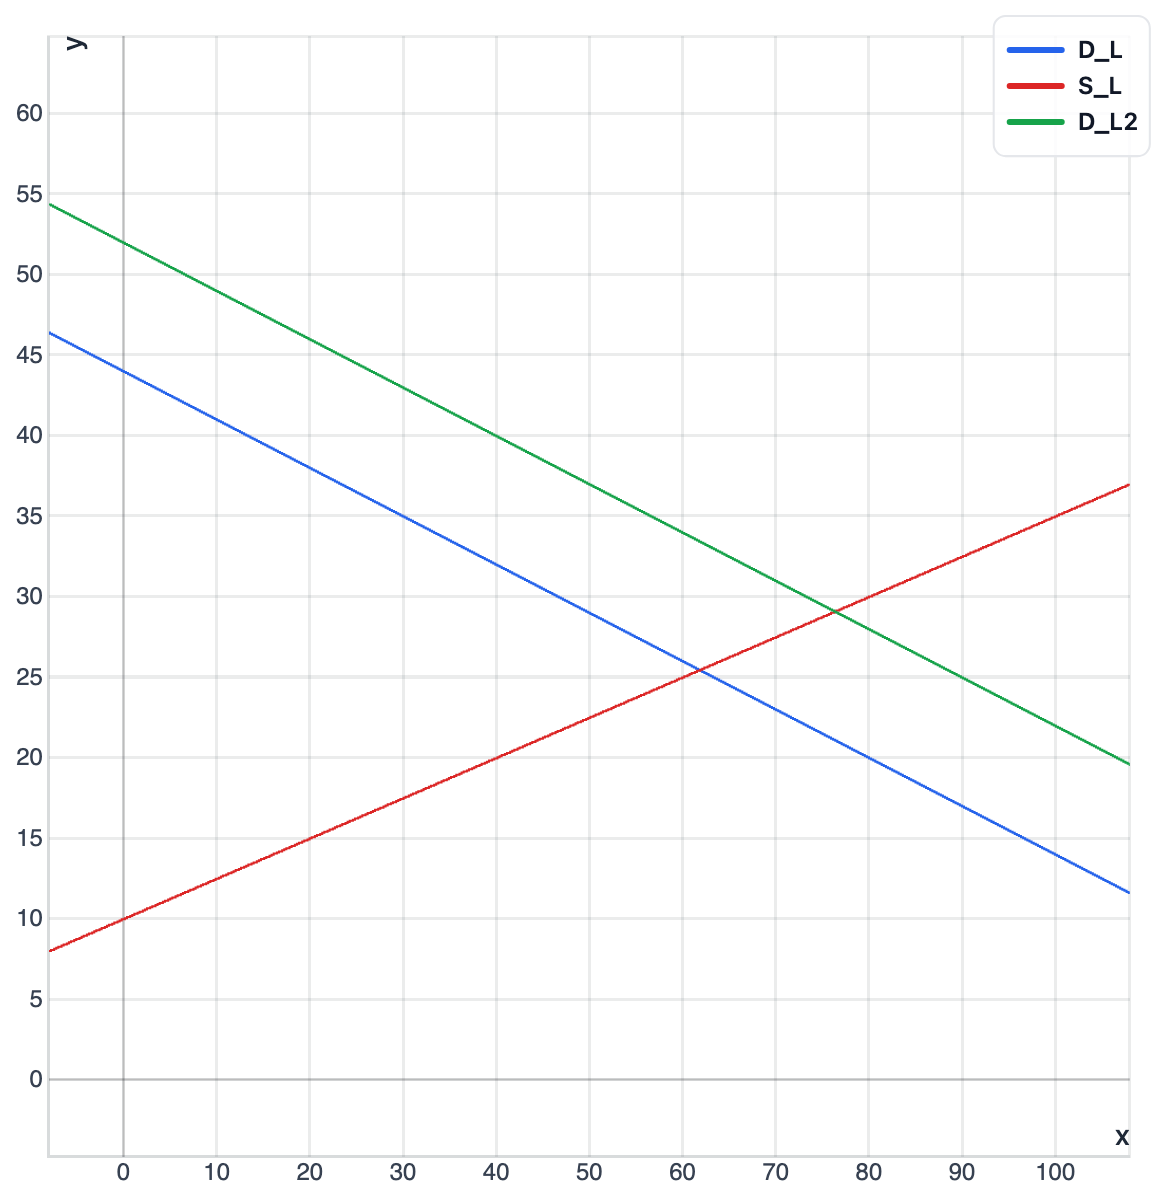
The equilibrium wage decreases, and the equilibrium quantity of labor increases.
The equilibrium wage decreases, and the equilibrium quantity of labor decreases.
Employment falls because the higher wage causes a movement along labor supply to a smaller quantity supplied.
The equilibrium wage increases, and the equilibrium quantity of labor increases.
The equilibrium wage increases, and the equilibrium quantity of labor decreases.
Explanation
This question examines changes in factor demand and supply through technological improvements affecting productivity. Labor demand depends on workers' marginal product—how much additional output each worker produces—multiplied by the value of that output. When harvesting machines allow farm workers to pick more crops per hour, their marginal product increases, making each worker more valuable to employers. This productivity increase shifts the labor demand curve right, as firms are willing to hire more workers at every wage level. The new equilibrium features both higher wages and higher employment. A misconception is thinking machines always replace workers, but when technology makes workers more productive rather than replacing them, it increases labor demand. The strategy for analyzing productivity changes involves identifying how technology affects worker output (increases it), determining the impact on labor demand (shifts right), and finding the new equilibrium (higher wage, higher quantity).
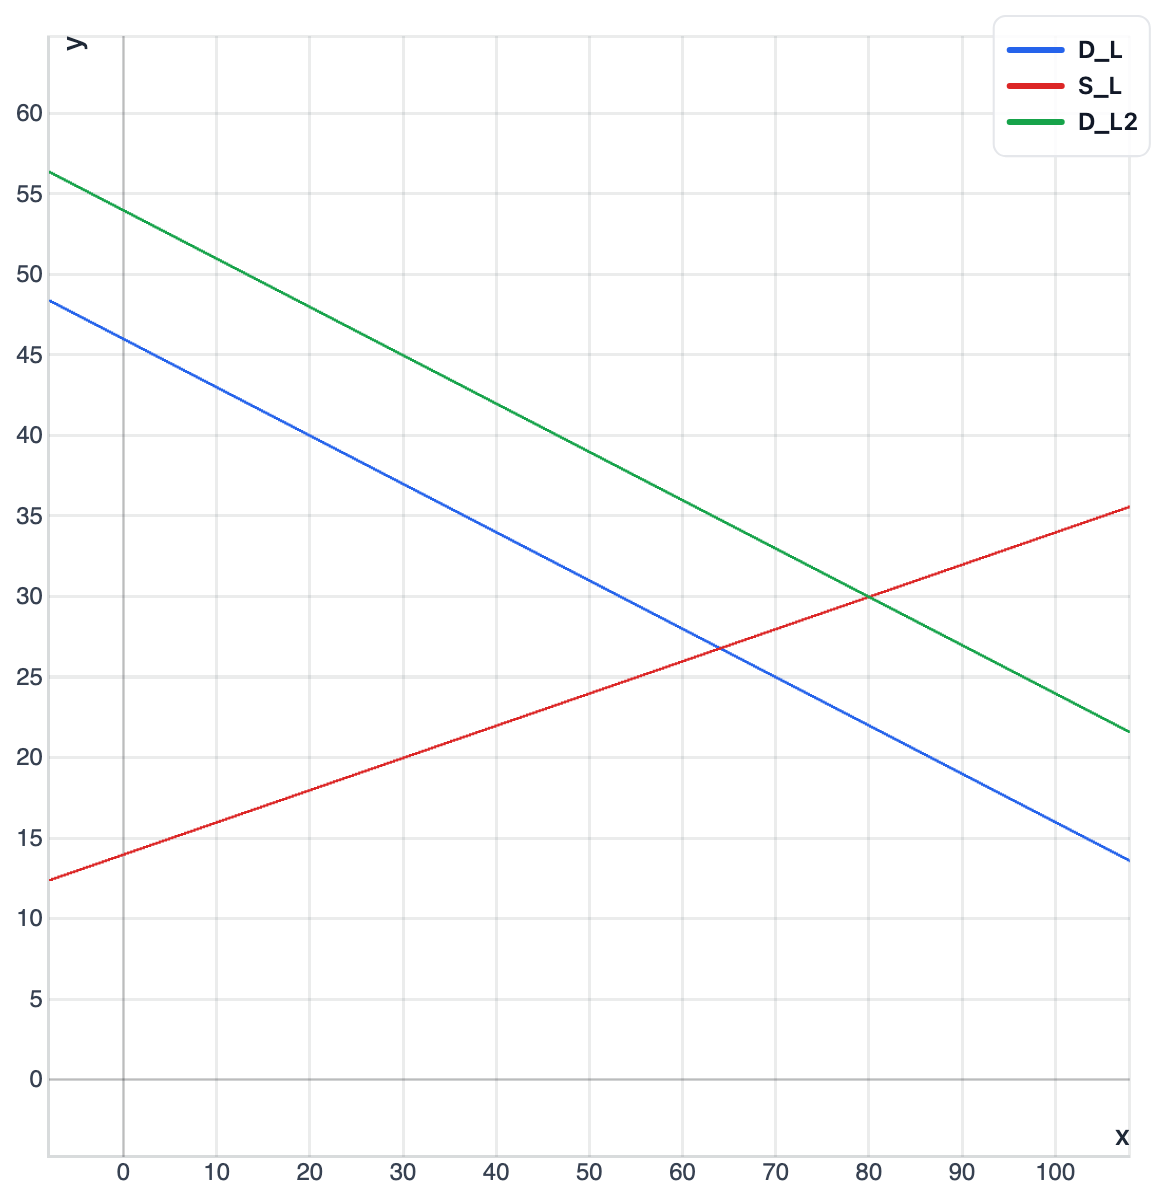
In a competitive labor market for registered nurses, several hospitals in a city expand capacity after an increase in the demand for healthcare services. Based on the labor market graph shown, what happens to the equilibrium wage and quantity of labor?
The equilibrium wage decreases, and the equilibrium quantity of labor decreases.
The equilibrium wage increases, and the equilibrium quantity of labor decreases.
The equilibrium wage decreases, and the equilibrium quantity of labor increases.
The equilibrium wage increases, and the equilibrium quantity of labor increases.
The wage rises due to a movement along labor demand, and the quantity of labor falls.
Explanation
This question tests your understanding of changes in factor demand and supply in labor markets. Labor demand is derived from the demand for the product or service that workers produce, combined with their productivity in creating that output. When hospitals expand capacity due to increased healthcare demand, they need more nurses, causing the labor demand curve to shift right. This rightward shift in labor demand creates a new equilibrium at a higher wage and higher quantity of labor employed. A common misconception is confusing movements along curves with shifts of curves—this is a shift of the entire demand curve, not just a movement along it. To solve these problems, first identify which determinant changed (here, product demand increased), then shift the appropriate curve (demand shifts right), and finally read the new equilibrium point (higher wage, higher quantity).
In a competitive labor market for electricians, the government expands access to apprenticeship programs, increasing the number of qualified electricians over time. Based on the labor market graph shown, which change best explains the shift shown?
An increase in the demand for electrical services, increasing labor demand.
An increase in the number of qualified workers, increasing labor supply.
A decrease in the number of firms hiring electricians, increasing labor demand.
A decrease in worker productivity, decreasing labor demand.
A higher wage causing a movement along labor supply to a smaller quantity supplied.
Explanation
This question focuses on identifying changes in factor demand and supply, specifically examining labor supply determinants. Labor demand reflects firms' hiring decisions based on productivity and output prices, while labor supply depends on the number of qualified workers available. Government-expanded apprenticeship programs increase the number of qualified electricians over time, causing the labor supply curve to shift right as more workers can enter this occupation. This rightward shift in labor supply leads to a new equilibrium with lower wages but higher employment levels. Students sometimes incorrectly assume that more training always increases wages, but when supply increases faster than demand, wages actually fall. The key to solving these problems is identifying which market determinant changed (number of qualified workers increased), determining the curve shift direction (supply shifts right with more workers), and reading the new equilibrium outcome (lower wage, higher quantity).
In a competitive labor market for delivery drivers, a surge in online shopping increases the demand for delivery services, raising firms' demand for drivers. Based on the labor market graph shown, which determinant of labor demand caused this outcome?
An increase in demand for the output produced, shifting labor demand right.
A decrease in the number of available drivers, shifting labor supply left.
A decrease in consumer demand for delivered goods, shifting labor demand left.
An improvement in technology that reduces the marginal product of labor, shifting labor demand left.
A higher wage causing a movement along labor demand to a larger quantity of labor demanded.
Explanation
This question tests understanding of changes in factor demand and supply by identifying specific determinants. Labor demand is derived from the demand for the product or service workers help produce—when product demand increases, firms need more workers to meet that demand. The surge in online shopping increases demand for delivery services, which raises firms' demand for delivery drivers at every wage level, shifting the labor demand curve right. This represents a change in product demand, one of the key determinants of labor demand, rather than a wage-induced movement along the curve. A common error is confusing shifts with movements—this is a shift of the entire demand curve due to increased product demand, not a movement along it due to wage changes. To identify the correct determinant, trace the causal chain: increased online shopping → higher delivery service demand → increased demand for drivers, then recognize this as a product demand change shifting labor demand right.
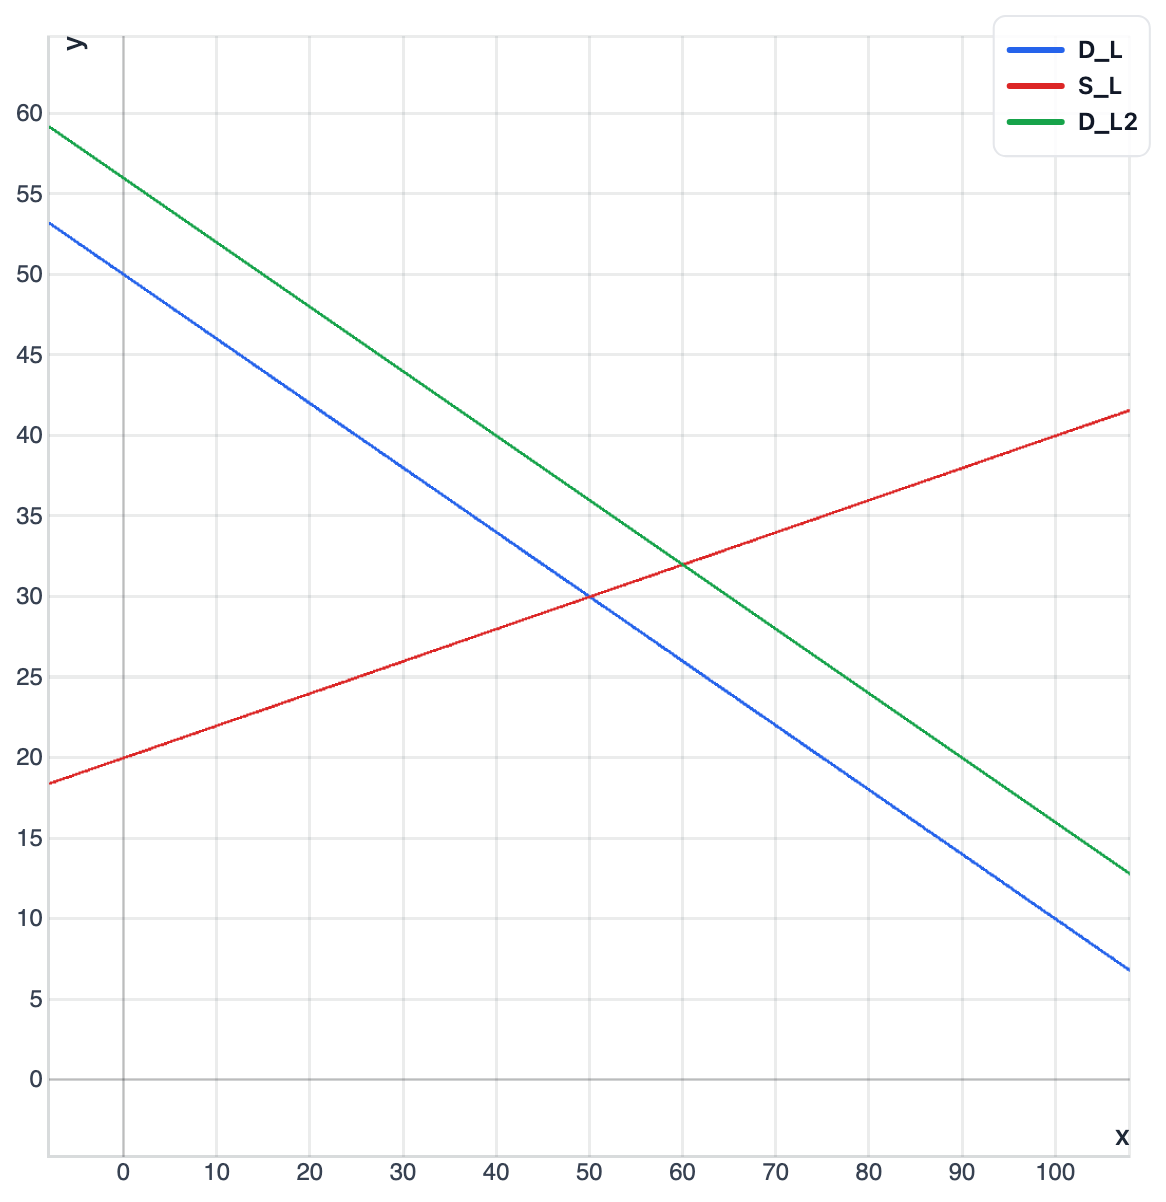
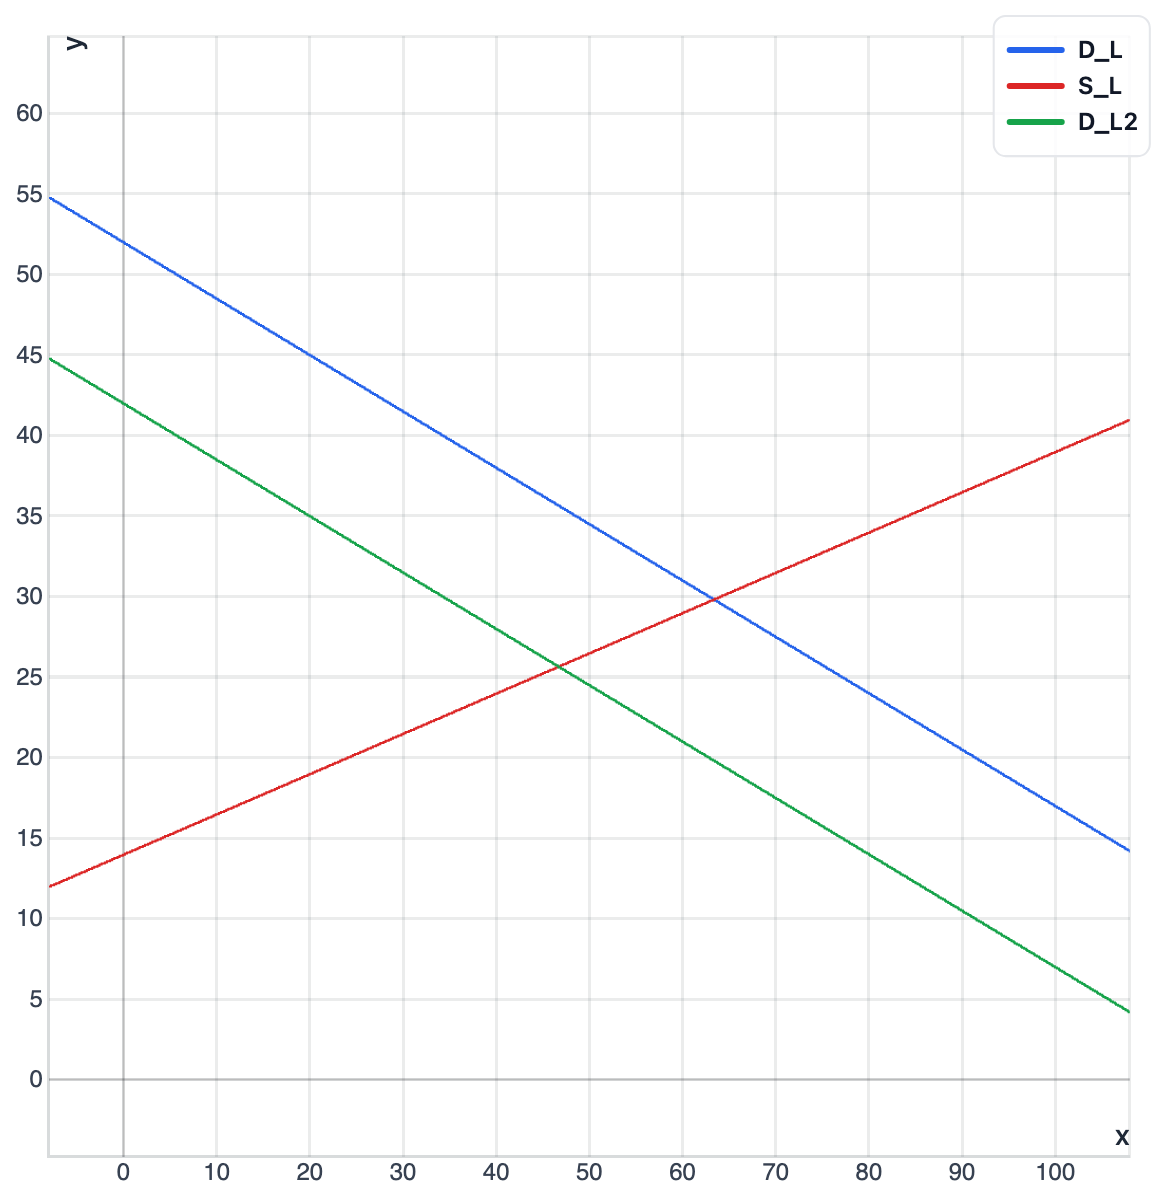
In a competitive labor market for construction workers, a recession reduces the demand for new housing, lowering the price and quantity of construction output. Based on the labor market graph shown, what happens to the equilibrium wage and quantity of labor?

Wages fall due to a movement along labor supply, and employment is unchanged.
The equilibrium wage increases, and the equilibrium quantity of labor increases.
The equilibrium wage decreases, and the equilibrium quantity of labor increases.
The equilibrium wage decreases, and the equilibrium quantity of labor decreases.
The equilibrium wage increases, and the equilibrium quantity of labor decreases.
Explanation
This question examines changes in factor demand and supply in labor markets during economic downturns. Labor demand is derived from the demand for the final product—when fewer houses are demanded, construction firms need fewer workers to build them. A recession that reduces housing demand causes the labor demand curve for construction workers to shift left, as firms require fewer workers at every wage level. This leftward shift in labor demand results in a new equilibrium with both lower wages and lower quantity of labor employed. A common misconception is thinking that labor market changes are independent of product market conditions, but labor demand directly depends on product demand. To analyze these situations, trace the connection from product market to labor market (lower housing demand means lower labor demand), shift the appropriate curve (demand shifts left), and identify the new equilibrium (lower wage, lower quantity).
In a competitive labor market for software engineers, a breakthrough developer tool increases programmers' productivity, raising firms' marginal revenue product of labor. Based on the labor market graph shown, which change best explains the shift shown?
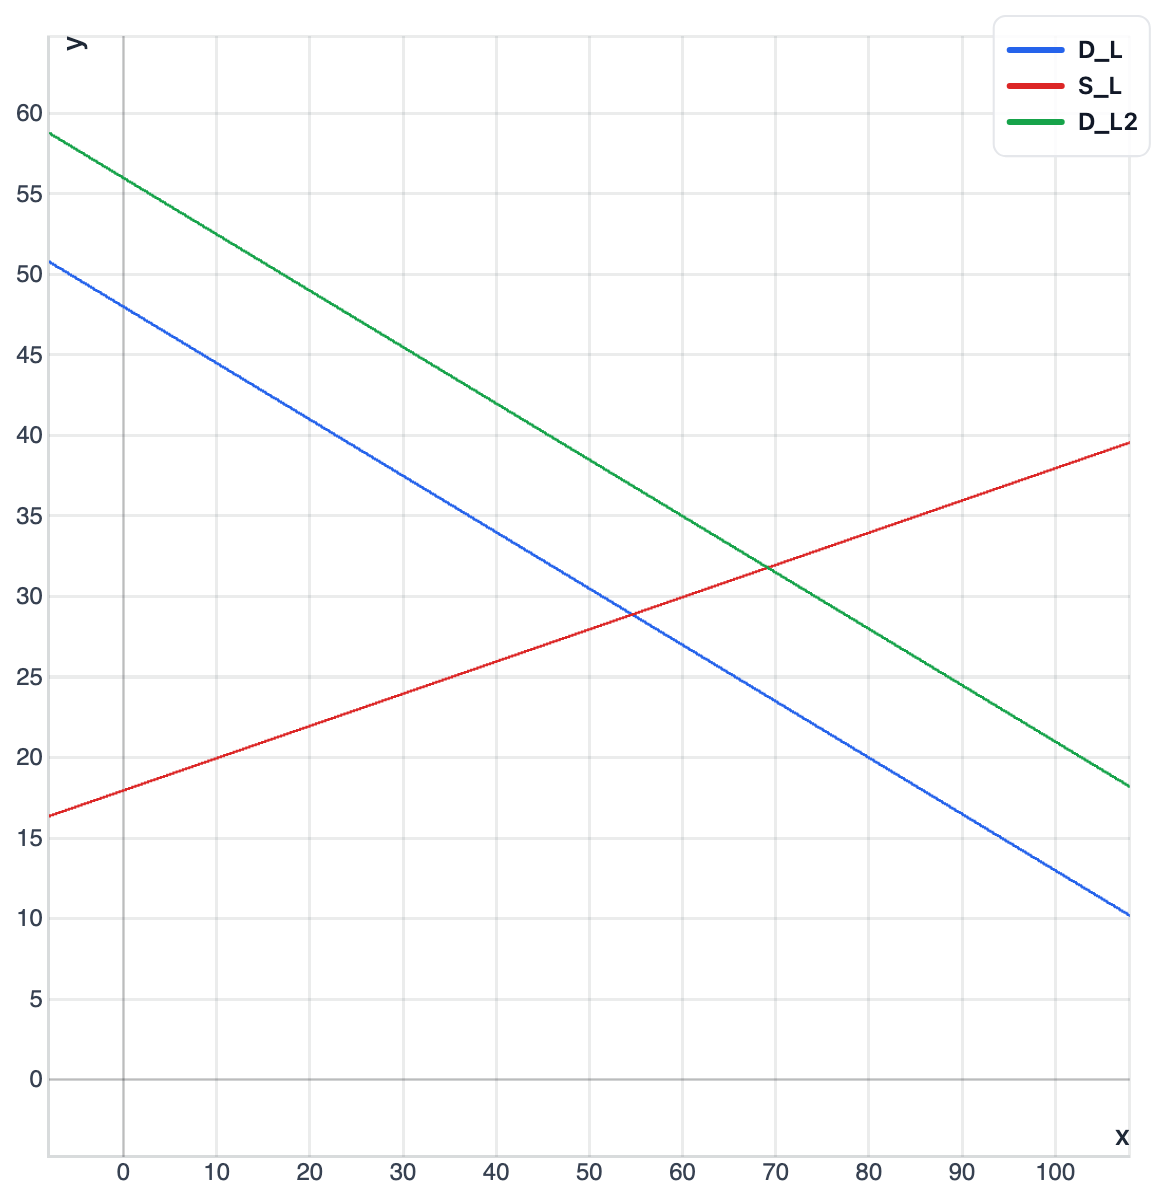
An increase in worker productivity that raises marginal revenue product, increasing labor demand.
A decrease in worker productivity, reducing the marginal product of labor.
An increase in the number of engineers entering the market, increasing labor supply.
A higher wage causing a movement up along labor demand, increasing labor demanded.
A decrease in the price of the output produced by software firms, reducing labor demand.
Explanation
This question focuses on identifying changes in factor demand and supply in labor markets. Labor demand is derived from both the price of the output produced and the productivity of workers—when either increases, firms' marginal revenue product of labor rises. The breakthrough developer tool increases programmer productivity, meaning each engineer can produce more valuable output per hour, raising their marginal revenue product. This increase in productivity causes the labor demand curve to shift right, as firms are willing to hire more engineers at every wage level. A common error is thinking higher wages cause demand shifts, but wage changes only cause movements along existing curves, not shifts of the curves themselves. To analyze such scenarios, identify what changed about worker productivity or output value, determine how this affects firms' willingness to hire (demand increases), and recognize that the demand curve shifts right when productivity rises.
In a competitive labor market for graphic designers, an AI-based design platform reduces the need for designers at each wage because firms can produce the same output with fewer designers. Based on the labor market graph shown, what happens to the equilibrium wage and quantity of labor?
The equilibrium wage increases, and the equilibrium quantity of labor decreases.
The equilibrium wage decreases, and the equilibrium quantity of labor increases.
The equilibrium wage increases, and the equilibrium quantity of labor increases.
The wage falls due to a movement along labor demand, and employment is unchanged.
The equilibrium wage decreases, and the equilibrium quantity of labor decreases.
Explanation
This question examines changes in factor demand and supply when technology substitutes for labor. Labor demand reflects firms' need for workers based on their productivity and the value of output produced. When AI design platforms allow firms to produce the same output with fewer designers, this effectively reduces the marginal product of human designers, as each designer now adds less value when AI handles part of the work. This causes the labor demand curve to shift left, as firms need fewer designers at every wage level. The new equilibrium shows both lower wages and lower employment for graphic designers. A common misconception is that all technological change increases labor demand, but labor-substituting technology reduces it. To analyze these scenarios, determine whether technology complements or substitutes for workers (here it substitutes), identify the curve shift (demand shifts left), and find the new equilibrium (lower wage, lower quantity).