The Loanable Funds Market
Help Questions
AP Macroeconomics › The Loanable Funds Market
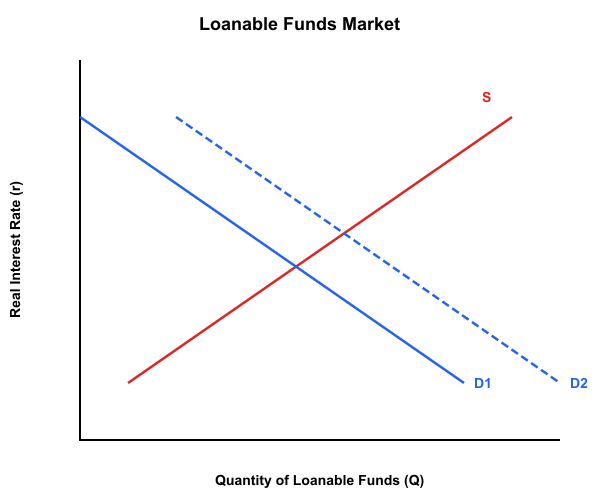
Based on the loanable funds market shown, firms become more optimistic about future profitability and increase planned investment at each real interest rate. Which outcome is most consistent with the model?
Initial equilibrium: $r_1=3%$, $Q_1=250$.
Demand for loanable funds shifts right from $D_1$ to $D_2$ (higher investment demand), while saving supply remains at $S_1$.
The real interest rate is unchanged, and equilibrium quantity is unchanged because investment must equal saving at all rates.
The real interest rate rises, and equilibrium quantity of loanable funds rises as investment demand increases.
The nominal interest rate rises, and equilibrium quantity rises because the money supply increases.
The real interest rate rises, and equilibrium quantity of loanable funds falls as saving supply decreases.
The real interest rate falls, and equilibrium quantity of loanable funds rises as saving demand increases.
Explanation
The loanable funds market is a model where the supply of loanable funds comes from household and business saving, while the demand comes from firms' investment borrowing and government deficits. In this market, saving plays the role of providing funds available for lending, and investment represents the borrowing for capital projects, with the real interest rate equilibrating the two. Referring to the description, the rightward shift in demand from D1 to D2 due to optimism raises the real interest rate from 3% and increases the quantity from 250. A common misconception is confusing the loanable funds market with the money market, where nominal rates are determined by money supply and demand, not real rates by saving and investment. To analyze changes, use the transferable strategy of identifying which side shifts: here, demand shifts right due to higher investment, leading to higher rates and quantity.
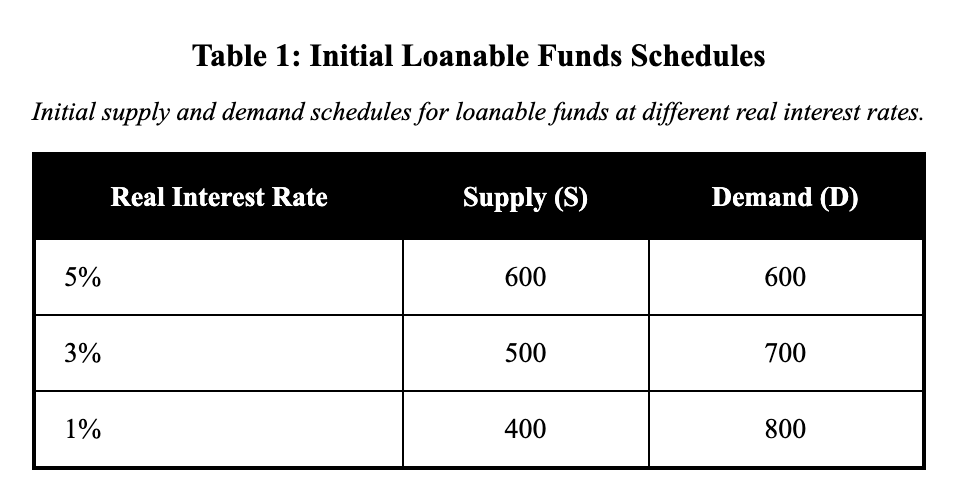
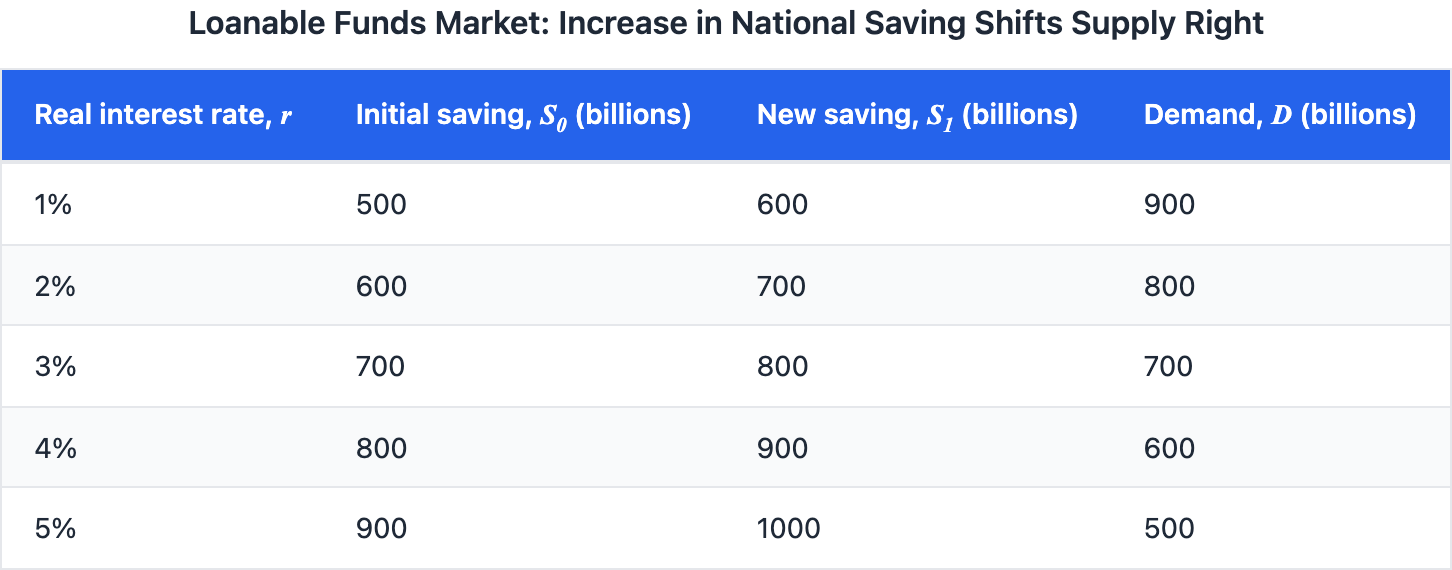
Based on the loanable funds market shown in the table, a tax policy increases after-tax returns to saving, increasing saving at each real interest rate. Using the data as the initial schedules, which statement best describes the new equilibrium relative to the initial equilibrium?
Initial Loanable Funds Schedules
At $r=5%$: $S=600$, $D=600$
At $r=3%$: $S=500$, $D=700$
At $r=1%$: $S=400$, $D=800$
(Quantities are in billions of dollars per year.)
Real interest rate decreases, quantity of loanable funds increases, and private investment increases at the new equilibrium.
Real interest rate is unchanged, quantity of loanable funds is unchanged, and private investment is unchanged at the new equilibrium.
Real interest rate decreases, quantity of loanable funds decreases, and private investment decreases at the new equilibrium.
Nominal interest rate decreases, quantity of money increases, and private investment increases at the new equilibrium.
Real interest rate increases, quantity of loanable funds increases, and private investment decreases at the new equilibrium.
Explanation
The loanable funds market is a model where the supply of loanable funds comes from household and business saving, while the demand comes from firms' investment borrowing and government deficits. In this market, saving plays the role of providing funds available for lending, and investment represents the borrowing for capital projects, with the real interest rate equilibrating the two. Referring to the table, the tax policy shifts supply right, lowering the real interest rate from 5% and raising the quantity from 600 billion, increasing private investment. A common misconception is confusing the loanable funds market with the money market, where nominal rates are determined by money supply and demand, not real rates by saving and investment. To analyze changes, use the transferable strategy of identifying which side shifts: here, supply shifts right due to higher saving, leading to lower rates and higher investment.
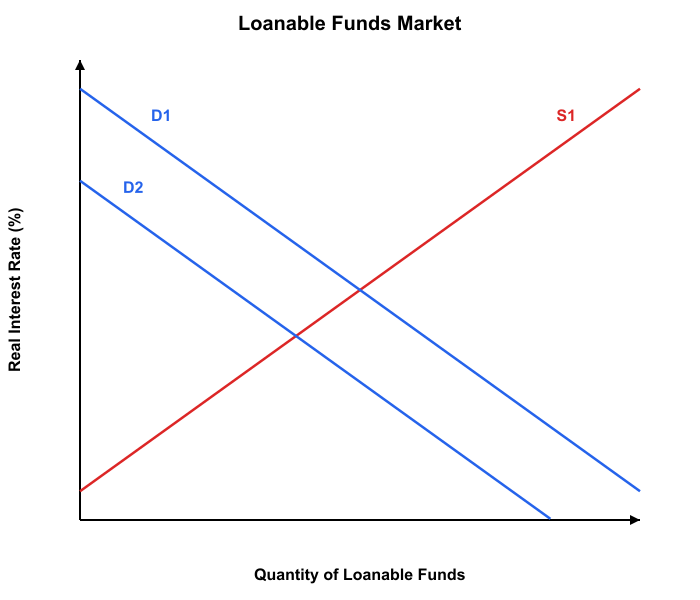
Based on the loanable funds market shown in the graph, the government reduces its budget deficit, decreasing government borrowing. Holding everything else constant, which outcome is most consistent with the model?
Initial equilibrium at $r_1=5%$ and $Q_1=400$.
Demand shifts left from $D_1$ to $D_2$ (lower government borrowing), while supply remains at $S_1$.
The real interest rate is unchanged, and private investment is unchanged because the demand curve is vertical.
The nominal interest rate decreases, and private investment increases because the central bank buys bonds.
The real interest rate increases, and private investment decreases because less saving is available to lend.
The real interest rate decreases, and private investment increases because less government borrowing reduces crowding out.
The real interest rate decreases, and private investment decreases because higher saving lowers investment demand.
Explanation
The loanable funds market is a model where the supply of loanable funds comes from household and business saving, while the demand comes from firms' investment borrowing and government deficits. In this market, saving plays the role of providing funds available for lending, and investment represents the borrowing for capital projects, with the real interest rate equilibrating the two. Referring to the graph, the leftward shift in demand from D1 to D2 due to reduced government borrowing lowers the real interest rate from 5% and decreases the quantity from 400, boosting private investment. A common misconception is confusing the loanable funds market with the money market, where nominal rates are determined by money supply and demand, not real rates by saving and investment. To analyze changes, use the transferable strategy of identifying which side shifts: here, demand shifts left, leading to lower rates and reduced crowding out.
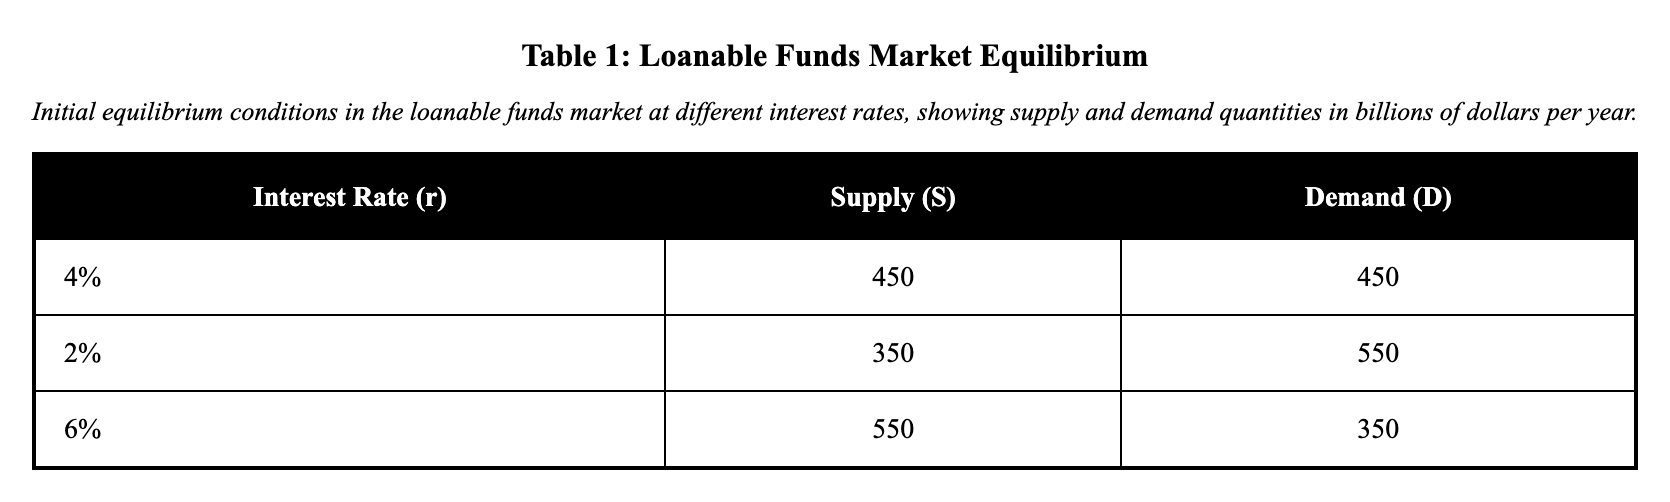
Based on the loanable funds market shown in the table, the government increases borrowing to finance higher spending, while private investment demand is unchanged. Which change is most consistent with the loanable funds model?
Initial Equilibrium
At $r=4%$: $S=450$, $D=450$
At $r=2%$: $S=350$, $D=550$
At $r=6%$: $S=550$, $D=350$
(Quantities are in billions of dollars per year.)
Demand shifts left, the real interest rate falls, and private investment is crowded out at the new equilibrium.
Demand shifts right, the real interest rate rises, and private investment is crowded out at the new equilibrium.
Demand shifts right, the real interest rate falls, and private investment rises at the new equilibrium.
Supply shifts right, the real interest rate rises, and private investment rises at the new equilibrium.
Supply shifts left, the nominal interest rate rises, and private investment rises at the new equilibrium.
Explanation
The loanable funds market is a model where the supply of loanable funds comes from household and business saving, while the demand comes from firms' investment borrowing and government deficits. In this market, saving plays the role of providing funds available for lending, and investment represents the borrowing for capital projects, with the real interest rate equilibrating the two. Referring to the table, increased government borrowing shifts demand right, raising the real interest rate from 4% and increasing the quantity from 450 billion, crowding out private investment. A common misconception is confusing the loanable funds market with the money market, where nominal rates are determined by money supply and demand, not real rates by saving and investment. To analyze changes, use the transferable strategy of identifying which side shifts: here, demand shifts right, leading to higher rates and crowding out.
Based on the loanable funds market shown in the graph, the government increases borrowing while households simultaneously increase saving at each real interest rate. Which outcome is most consistent with the model?
Supply shifts right from $S_1$ to $S_2$ (higher saving), and demand shifts right from $D_1$ to $D_2$ (higher government borrowing). The shifts are shown as approximately equal in size.
The nominal interest rate is unchanged, and the equilibrium quantity of money rises because both curves shift right equally.
The real interest rate is unchanged, and the equilibrium quantity of loanable funds falls because crowding out dominates saving.
The real interest rate falls, and the equilibrium quantity of loanable funds rises because demand shifts right more than supply.
The real interest rate is unchanged, and the equilibrium quantity of loanable funds rises because both curves shift right equally.
The real interest rate rises, and the equilibrium quantity of loanable funds is unchanged because both curves shift right equally.
Explanation
The loanable funds market is a model where the supply of loanable funds comes from household and business saving, while the demand comes from firms' investment borrowing and government deficits. In this market, saving plays the role of providing funds available for lending, and investment represents the borrowing for capital projects, with the real interest rate equilibrating the two. Referring to the graph, equal rightward shifts in supply (S1 to S2) and demand (D1 to D2) keep the real interest rate unchanged while increasing the quantity. A common misconception is confusing the loanable funds market with the money market, where nominal rates are determined by money supply and demand, not real rates by saving and investment. To analyze changes, use the transferable strategy of identifying which side shifts: here, both shift right equally, leading to unchanged rates and higher quantity.
Based on the loanable funds market shown in the table, suppose the government reduces its budget deficit, decreasing government borrowing while private investment demand and saving behavior are unchanged. In the loanable funds model (not the money market), which outcome is most likely?
The real interest rate increases, and private investment decreases due to increased crowding out.
The nominal interest rate decreases, and private investment increases because money demand falls.
The real interest rate is unchanged, and private investment is unchanged because saving equals investment.
The real interest rate decreases, and private investment increases due to reduced crowding out.
The real interest rate decreases, and private investment decreases because saving shifts left.
Explanation
The loanable funds market is where savers supply funds through saving and borrowers demand funds for investment, with the real interest rate acting as the price that equilibrates supply and demand. In this market, saving represents the supply of loanable funds, while investment by firms and government borrowing represent the demand. Reducing the government deficit decreases borrowing, shifting demand left, which lowers the real interest rate and increases private investment by reducing crowding out, as indicated in table-based models showing a leftward demand shift. A common misconception is confusing this with the money market, where nominal interest rates are determined by money supply and demand, but here we focus on real rates and loanable funds rather than liquidity. To analyze changes, identify which side shifts: here, demand decreases due to less government borrowing, lowering rates and encouraging private investment. This highlights how fiscal restraint can support private sector growth through cheaper credit.
Based on the loanable funds market shown in the table below, the government increases spending without raising taxes, increasing government borrowing by $100$ (billions) at each real interest rate. Which statement best describes the effect on private investment in equilibrium?

Private investment increases because the real interest rate rises, creating crowding in.
Private investment decreases because the real interest rate falls, creating crowding out.
Private investment decreases because the real interest rate rises, creating crowding out.
Private investment is unchanged because government borrowing does not affect loanable funds demand.
Private investment increases because the real interest rate falls, creating crowding out.
Explanation
The loanable funds market brings together savers (supply) and borrowers including firms and government (demand), with the real interest rate as the price mechanism. When government increases spending without raising taxes, it must borrow more, shifting the demand curve for loanable funds rightward by $100 billion. This increased demand for the limited supply of savings drives up the real interest rate. As the interest rate rises, some private investment projects become unprofitable, causing firms to reduce their investment—this is the crowding out effect. Even though total borrowing (government plus private) increases in equilibrium, private investment specifically decreases because government borrowing has 'crowded out' some private borrowing through higher interest rates. Students often confuse the total quantity of loanable funds with private investment alone—remember that increased government borrowing can increase total borrowing while reducing the private component. The key mechanism is that government borrowing raises interest rates, which discourages private investment.
Based on the loanable funds market shown in the table below, an increase in household thrift raises national saving by $100$ (billions of dollars) at each real interest rate. What happens to the equilibrium real interest rate and to private investment (quantity of loanable funds demanded by firms) in equilibrium?
The real interest rate rises and private investment rises in equilibrium.
The real interest rate falls and private investment rises in equilibrium.
The real interest rate rises and private investment falls in equilibrium.
The real interest rate falls and private investment falls in equilibrium.
The real interest rate is unchanged and private investment is unchanged in equilibrium.
Explanation
The loanable funds market equilibrates saving (supply) and investment plus government borrowing (demand) through changes in the real interest rate. When households become more thrifty and save an additional $100 billion at each interest rate, the supply curve shifts rightward. With more funds available at each interest rate and demand unchanged, the real interest rate must fall to encourage borrowers to take up the additional savings. At the lower equilibrium interest rate, firms find more investment projects profitable, so private investment increases. A common error is thinking that more saving reduces investment—actually, more saving makes more funds available for investment at lower rates. To analyze such changes, always identify which curve shifts: increased saving shifts supply right, lowering rates and increasing equilibrium quantity.
Based on the loanable funds market shown, firms become more optimistic about future profitability and increase planned investment at each real interest rate. Which outcome is most consistent with the model?
Initial equilibrium: $r_1=3%$, $Q_1=250$.
Demand for loanable funds shifts right from $D_1$ to $D_2$ (higher investment demand), while saving supply remains at $S_1$.
The nominal interest rate rises, and equilibrium quantity rises because the money supply increases.
The real interest rate rises, and equilibrium quantity of loanable funds rises as investment demand increases.
The real interest rate falls, and equilibrium quantity of loanable funds rises as saving demand increases.
The real interest rate rises, and equilibrium quantity of loanable funds falls as saving supply decreases.
The real interest rate is unchanged, and equilibrium quantity is unchanged because investment must equal saving at all rates.
Explanation
The loanable funds market is a model where the supply of loanable funds comes from household and business saving, while the demand comes from firms' investment borrowing and government deficits. In this market, saving plays the role of providing funds available for lending, and investment represents the borrowing for capital projects, with the real interest rate equilibrating the two. Referring to the description, the rightward shift in demand from D1 to D2 due to optimism raises the real interest rate from 3% and increases the quantity from 250. A common misconception is confusing the loanable funds market with the money market, where nominal rates are determined by money supply and demand, not real rates by saving and investment. To analyze changes, use the transferable strategy of identifying which side shifts: here, demand shifts right due to higher investment, leading to higher rates and quantity.
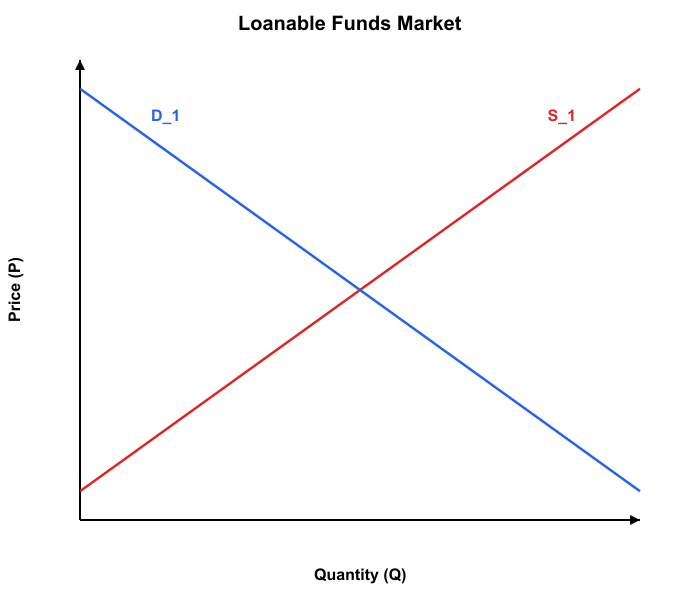
Based on the loanable funds market shown in the graph, the government increases its budget deficit, financed by borrowing. Holding everything else constant, which outcome is most consistent with the model?
Loanable Funds Market
Vertical axis: Real interest rate ($r$)
Horizontal axis: Quantity of loanable funds ($Q$)
Initial equilibrium at $r_1 = 4%$ and $Q_1 = 300$.
Demand shifts right from $D_1$ to $D_2$ (government borrowing increases), while supply remains at $S_1$.
The real interest rate increases, and private investment decreases because government borrowing crowds out some investment.
The real interest rate is unchanged, and private investment is unchanged because saving must always equal investment.
The real interest rate decreases, and private investment decreases because saving falls as interest rates fall.
The nominal interest rate increases, and private investment decreases because the money supply contracts.
The real interest rate decreases, and private investment increases because loanable funds become cheaper.
Explanation
The loanable funds market is a model where the supply of loanable funds comes from household and business saving, while the demand comes from firms' investment borrowing and government deficits. In this market, saving plays the role of providing funds available for lending, and investment represents the borrowing for capital projects, with the real interest rate equilibrating the two. Referring to the graph, the rightward shift in demand from D1 to D2 due to increased government borrowing raises the real interest rate from 4% and increases the quantity from 300, but crowds out private investment. A common misconception is confusing the loanable funds market with the money market, where nominal rates are determined by money supply and demand, not real rates by saving and investment. To analyze changes, use the transferable strategy of identifying which side shifts: here, demand shifts right due to government borrowing, leading to higher rates and crowding out.