Supply
Help Questions
AP Macroeconomics › Supply
Based on the supply curve shown, the question concerns a shift of supply. The government introduces a per-unit subsidy for producers that reduces firms’ effective costs. Which option best matches the shift shown in the graph?
(Use the graph to identify whether supply increased or decreased.)
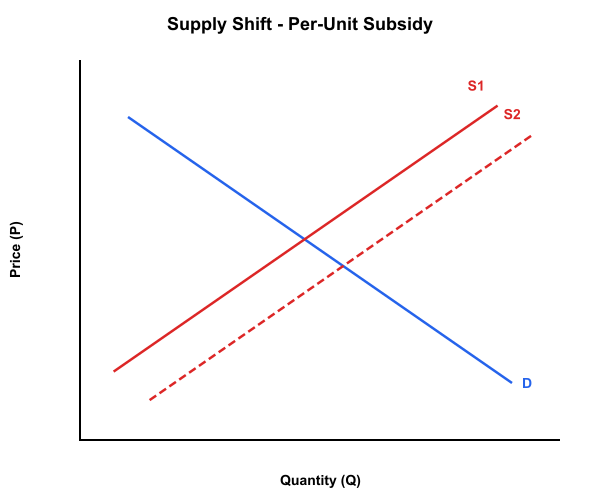
A rightward shift from $S_1$ to $S_2$ because consumer preferences increase purchases
A rightward shift from $S_1$ to $S_2$ because a subsidy lowers per-unit costs to producers
A leftward shift from $S_1$ to $S_2$ because a subsidy raises per-unit costs to producers
A movement up along $S_1$ because a higher price increases quantity supplied with no shift
A movement down along $S_1$ because a lower price decreases quantity supplied with no shift
Explanation
The supply curve illustrates the quantities firms supply at different prices, contrasting with quantity supplied at a fixed price. Shifts occur when cost determinants change, affecting supply at every price. The graph depicts a rightward shift from S1 to S2, showing increased supply with higher quantities at each price. This is explained by the subsidy lowering per-unit costs, boosting profitability and supply, as in choice C. A common misconception is treating this as a movement along the curve, but it's a shift from a cost reduction, not a price adjustment. Strategically, differentiate cost-side changes (shifts) from price changes (movements) for accurate analysis. Subsidies are a classic example of policies that shift supply rightward.
Based on the supply curve shown, the economy experiences a shift of supply from $S_1$ to $S_2$ after firms adopt AI-driven inventory and logistics systems that raise productivity in the short run. Which change in a macro-level determinant of supply is most consistent with the shift shown in the graph?
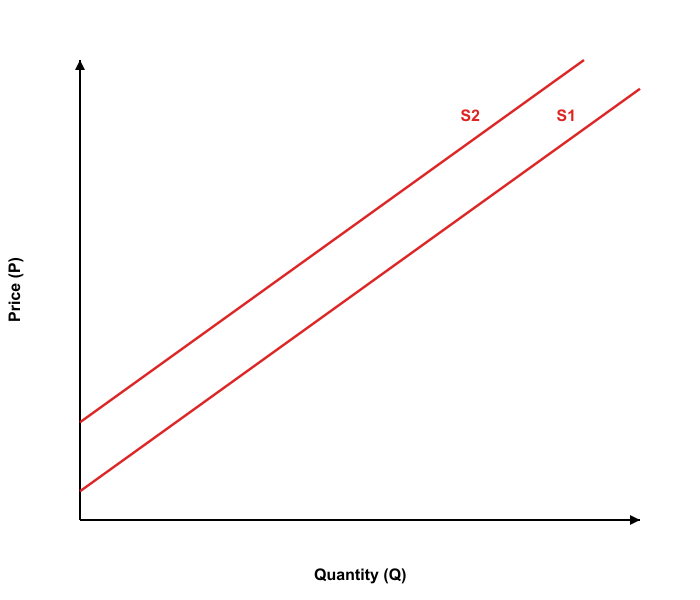
An increase in household income that raises spending and encourages firms to produce more.
A decrease in productivity that raises per-unit production costs at every output level.
An increase in input prices that lowers the amount firms can profitably supply at each price.
An improvement in technology that lowers per-unit production costs across the economy.
A decrease in the overall price level that causes producers to move to a lower quantity supplied.
Explanation
In macroeconomics, supply refers to the entire relationship between the price level and the quantity of goods and services firms are willing to produce, shown as a curve, while quantity supplied is the specific amount produced at a given price level along that curve. The graph depicts a rightward shift from S1 to S2, indicating an increase in supply where more output is supplied at every price level due to a non-price determinant change. The correct answer, C, follows because an improvement in technology, like AI-driven systems, lowers per-unit costs, making production more efficient and shifting supply rightward. A common misconception is confusing this shift with a movement along the curve, but movements occur only from price changes, whereas shifts result from factors like technology. To apply this transferable strategy, identify if the change affects cost-side factors like technology or input prices, which cause shifts, versus mere price changes that cause movements along the supply curve.
Based on the supply curve shown, the economy-wide market is experiencing a shift of supply. Suppose firms adopt widely used automation that raises labor productivity in the short run. Which option best matches the shift shown in the graph?
(Use the graph to determine the direction of the shift; do not assume it.)
A movement up along $S_1$ caused by a higher price level, raising quantity supplied
A rightward shift from $S_1$ to $S_2$ caused by higher productivity lowering per-unit costs
A rightward shift from $S_1$ to $S_2$ caused by higher household income increasing purchases
A movement down along $S_1$ caused by a lower price level, reducing quantity supplied
A leftward shift from $S_1$ to $S_2$ caused by higher unit production costs from lower productivity
Explanation
In economics, the supply curve represents the relationship between the price level and the quantity of goods and services that firms are willing to produce, while quantity supplied refers to the specific amount produced at a given price. A shift in the supply curve occurs when factors other than price change, such as technology or input costs, altering the quantity supplied at every price level. In this graph, the supply curve shifts rightward from S1 to S2, indicating an increase in supply, as seen by higher quantities at each price. This rightward shift follows from higher productivity lowering per-unit costs, making production more profitable and encouraging more output at every price, which matches choice C. A common misconception is confusing this shift with a movement along the curve, but here it's a shift because the cause is a cost-side change, not a price change. To apply this transferable strategy, identify whether the change affects production costs (causing a shift) or is solely a price adjustment (causing a movement along the curve). Remember, positive technological changes like automation typically shift supply rightward in the short run by enhancing efficiency.
Based on the supply curves shown, the economy experiences a shift of supply from $S_1$ to $S_2$ after a major hurricane destroys ports and factories, disrupting production and shipping. Which statement best matches the shift shown in the graph?
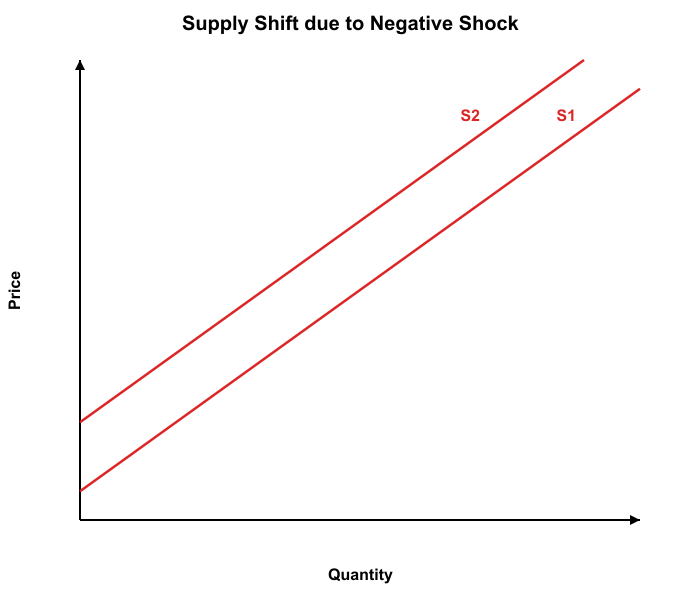
A positive technology shock increases supply at each price in the short run.
A negative supply shock reduces supply at each price in the short run.
A rise in the price level causes a movement along supply to a higher quantity supplied.
An increase in consumer income raises demand, shifting supply to the right.
A decrease in business taxes increases supply at each price in the short run.
Explanation
Supply represents the entire curve mapping price levels to quantities produced, while quantity supplied is the specific quantity at one price on that curve. The graph shows a leftward shift from S1 to S2, reducing supply at every price due to a disruption in production capabilities. Answer A matches because a negative supply shock, like a hurricane, increases costs and decreases supply, consistent with the shift. Misconceptions arise when confusing shifts with movements; for instance, thinking a price rise causes the shift instead of a movement to higher quantity supplied. To strategize, evaluate if the change impacts cost-side factors like productivity shocks, causing shifts, versus isolated price changes that prompt movements along the supply curve.
Based on the supply curve shown, the question concerns a shift of supply. A sustained increase in economy-wide wages raises unit labor costs for most industries. Which statement best matches the shift shown in the graph?
(Use the graph to determine whether the supply curve shifted left or right.)
A rightward shift from $S_1$ to $S_2$ because higher wages lower production costs
A rightward shift from $S_1$ to $S_2$ because consumer demand increases at each price
A movement up along $S_1$ because the price rises, increasing quantity supplied
A movement down along $S_1$ because the price falls, reducing quantity supplied
A leftward shift from $S_1$ to $S_2$ because higher wages raise production costs
Explanation
Supply encompasses the entire curve of price-quantity relationships, while quantity supplied is specific to one price. Supply shifts when input costs change, altering willingness to produce at every price. The graph shows a leftward shift from S1 to S2, with reduced quantities, indicating decreased supply. This is due to higher wages raising production costs, as described in choice B, making supply less at each price. Confusion often occurs by mistaking shifts for movements, but this is a cost-driven shift, not a price change. Use the strategy of separating cost-side factors (shifts) from price adjustments (movements). Wage increases are a common cause of leftward supply shifts in macroeconomics.