Graphing Polynomial Functions
Help Questions
Algebra 2 › Graphing Polynomial Functions
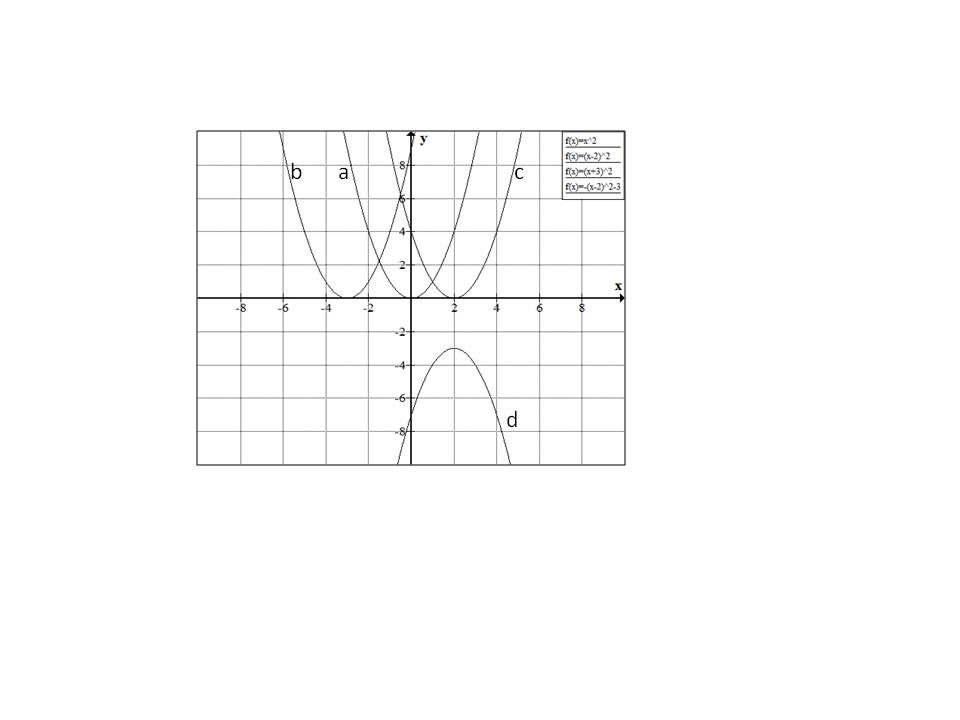
For the graph below, match the graph b with one of the following equations:


None of the above
Explanation
Starting with


Similarly 

Hence the correct answer is option 
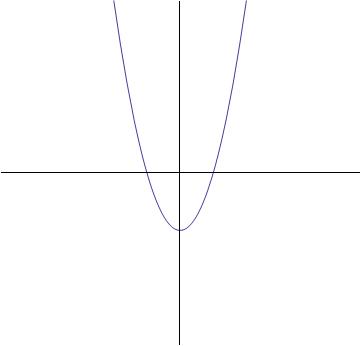
Which of the graphs best represents the following function?


None of these

Explanation
The highest exponent of the variable term is two (
The graph below will be the answer, as it shows a parabolic curve.

Where does the graph of 

Explanation
To find where the graph crosses the horizontal axis, we need to set the function equal to 0, since the 

To find the possible rational zeroes of a polynomial, use the rational zeroes theorem:
Our constant is 10, and our leading coefficient is 1. So here are our possible roots:
Let's try all of them and see if they work! We're going to substitute each value in for 
Looks like that worked! We got 0 as our final answer after synthetic substitution. What's left in the bottom row helps us factor 
We keep doing this process until 
Thus, 


How many 
have?
Two
One
Zero
Explanation
The graph of a quadratic function 


Since the question simply asks for the number of 
is

Set 
The discriminant is positive, so the 

Explanation
When we look at the function we see that the highest power of the function is a 3 which means it is an "odd degree" function. This means that the right and left side of the function will approach opposite directions. *Remember O for Odd and O for opposite.
In this case we also have a negative sign associated with the highest power portion of the function - this means that the function is flipped.
Both of these combine to make this an "odd negative" function.
Odd negative functions always have the right side of the function approaching down and the left side approaching up.
We represent this mathematically by saying that as x approaches negative infinity (left side), the function will approach positive infinity:
...and as x approaches positive infinity (right side) the function will approach negative infinity:


True, false, or undetermined: 

True
False
Undetermined
Explanation
As a polynomial function, the graph of 


Setting 
if 


Try without a calculator.
The graph with the following equation is a parabola characterized by which of the following?
Concave downward
Concave upward
Concave to the left
Concave to the right
None of these
Explanation
The parabola of an equation of the form 


How many 
One
Two
Zero
Ten
Five
Explanation
The graph of a quadratic function 


The number of 


The discriminant is equal to zero, so the quadratic equation has one real zero, and the graph of 


True or false: By the Intermediate Value Theorem,
False
True
Explanation
As a polynomial function, the graph of 


Setting 


However, the question is asking us to use the converse of this statement, which is not true in general. If 


The answer is false.
The vertex of the graph of the function
appears
on an axis.
in Quadrant I.
in Quadrant IV.
in Quadrant II.
in Quadrant III.
Explanation
The graph of the quadratic function 

Set 

Evaluate 
The vertex has 0 as its 


