Representing Data
Help Questions
Algebra 2 › Representing Data
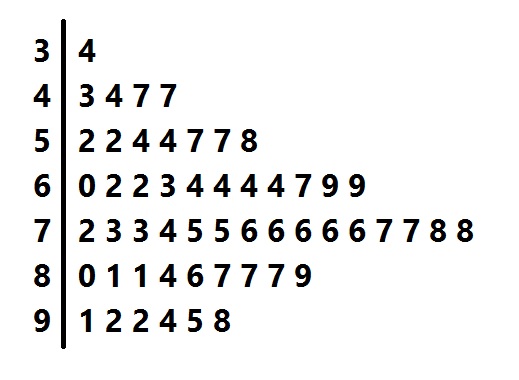
Above is a stem-and-leaf plot for the test scores administered to a group of students.
What was the median score?


Explanation
Each of the numbers in the leftmost column, or "stems" represents the tens digits of one or more scores; each digit in one of the rows, or "leaf", represents the units digit of a score.
The median score is the score that occurs in the middle when the scores are arranged from least to greatest, which there are, so we count up until we get to the middle score. There are 53, so we look for the

Above is a stem-and-leaf plot for the test scores administered to a group of students.
What was the median score?
Explanation
Each of the numbers in the leftmost column, or "stems" represents the tens digits of one or more scores; each digit in one of the rows, or "leaf", represents the units digit of a score.
The median score is the score that occurs in the middle when the scores are arranged from least to greatest, which there are, so we count up until we get to the middle score. There are 53, so we look for the

Above is a stem-and-leaf representation of the scores on a test administered to a group of students. What was the mode of the scores?


The set of scores has more than one mode.
Explanation
The mode of the data set is the score that occurs the most frequently.
Each "stem" in the left column represents the tens digits of the scores; each of the numbers in its row, or "leaf" represents the units digits. The entry that occurs the most frequently is represented by the "6" in the "7" row, so 76 is the one and only mode.
Above is a stem-and-leaf representation of the scores on a test administered to a group of students. What was the mode of the scores?
The set of scores has more than one mode.
Explanation
The mode of the data set is the score that occurs the most frequently.
Each "stem" in the left column represents the tens digits of the scores; each of the numbers in its row, or "leaf" represents the units digits. The entry that occurs the most frequently is represented by the "6" in the "7" row, so 76 is the one and only mode.
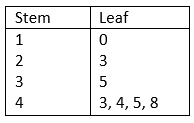
List the data values for the given Stem and Leaf plot.
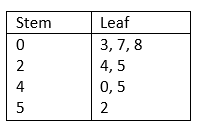
3, 7, 8, 24, 25, 40, 45, 52
2, 5, 25, 30, 42, 52, 70, 80
24, 25, 40, 45, 52
3, 7, 8, 24, 25, 45, 52
Explanation
The tens-digits are in the Stem column (left-side) while the ones-digits are in the Leaf column (right-side). Therefore, the data in the Stem and Leaf plot can be written as:

List the data values for the given Stem and Leaf plot.
3, 7, 8, 24, 25, 40, 45, 52
2, 5, 25, 30, 42, 52, 70, 80
24, 25, 40, 45, 52
3, 7, 8, 24, 25, 45, 52
Explanation
The tens-digits are in the Stem column (left-side) while the ones-digits are in the Leaf column (right-side). Therefore, the data in the Stem and Leaf plot can be written as:

The box and whisker plot above can be used to find all of the following information about the data set that it describes except:
The box and whisker plot gives you all of these.
Median Value
Range
Maximum and minimum values
The 4 quartiles of the data set
Explanation
The median value of the data set, 86, is represented by the dashed line inside the box.
The maximum and minimum of the data set, 100 and 75 (respectively), are found at the far ends of the 2 whiskers on either end.
The range of the data set is found by subtracting the minimum from the maximum; 100-75=25, so the range is 25.
The upper and lower quartiles are given by the two boundaries between the box and the whiskers: the lower quartile (1st quartile) is the left boundary, 80 in the data set; the upper quartile (3rd quartile) is the right boundary, which is 92 in the data set.
All of the other choices are provided by the box and whisker plot, so the correct choice is "The box and whisker plot gives you all of these"
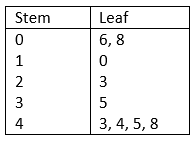
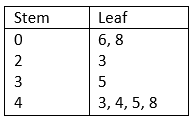
Create the Stem and Leaf plot for the given data values:
6, 8, 10, 23, 35, 43, 44, 45, 48
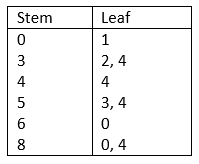
Explanation
The tens-digits are placed in the Stem column (left-side) and the ones-digits are placed in the Leaf column.
The data values are:
6, 8, 10, 23, 35, 43, 44, 45, 48
We can rewrite it as follow
06, 08, 10, 23, 35, 43, 44, 45, 48
Create the Stem and Leaf plot for the given data values:
6, 8, 10, 23, 35, 43, 44, 45, 48
Explanation
The tens-digits are placed in the Stem column (left-side) and the ones-digits are placed in the Leaf column.
The data values are:
6, 8, 10, 23, 35, 43, 44, 45, 48
We can rewrite it as follow
06, 08, 10, 23, 35, 43, 44, 45, 48